Пожалуйста, прочтите новое правило об ограничении использования AI-инструментов. ×

Visualizing Your Submissions verdict and rating combined

Правка en1, от Jeet_Karia, 2020-05-04 08:44:40

I have come up with a script that not only will show your number of correct/incorrect submissions but will also further subdivide them in terms of rating.

You can find the script here

Sample Input: (Suppose the name of handle is Jeet_Karia) python cf-sub-dist2.py --handle Jeet_Karia

Sample Output:
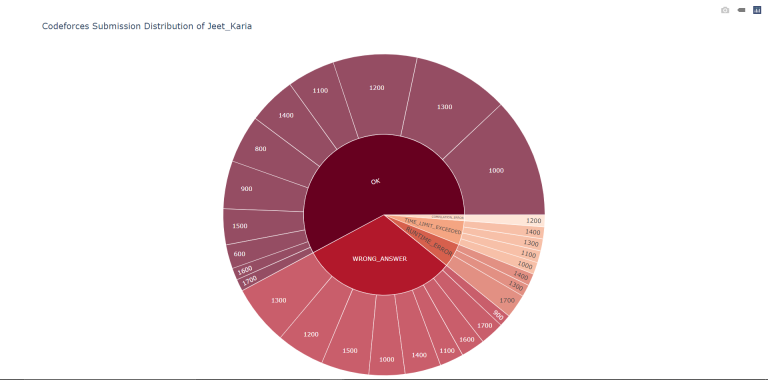
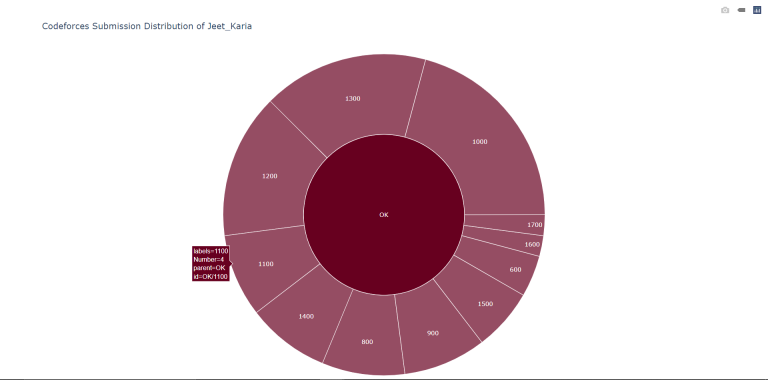
You can even interact with the pie chart and the changes after clicking on 'OK' (it's main component)
Теги #visualization, #submissions, #distribution, #python 3, #plotly, #piechart

История


Правки
 
 
  Rev. Язык Кто Когда Δ Комментарий
en2 Английский Jeet_Karia 2020-05-04 08:44:59 5
en1 Английский Jeet_Karia 2020-05-04 08:44:40 704 Initial revision (published)