


Rating-Based Heatmap: Visualize Real Progress!
Download from Chrome Web Store
Are you tired of the default Codeforces heatmap that merely tracks the number of problems solved without reflecting the actual effort behind each? Wouldn't it be great to see how much hard work you invested each day? Introducing the Codeforces Rating-Based Heatmap Extension — a clearer way to reflect your real progress!
Why Settle for Less?
The default Codeforces heatmap colors days based solely on the quantity of problems solved. It doesn't differentiate between solving easy Div3 problems or tackling complex Div1 challenges. This approach doesn't truly represent the difficulty you faced.
Additionally, some users may focus on solving easy problems just to maintain a streak. While streaks can be motivating, they don't always reflect real progress in problem-solving. True progress isn't just about maintaining streaks or solving easy problems. It's about stepping out of your comfort zone, facing challenges, and pushing your limits. Every tough problem you tackle brings you closer to becoming a stronger problem solver. With the Rating-Based Heatmap, this changes.
Note: The Rating-Based Heatmap will be added directly to your Codeforces profile page at codeforces.com/profile/YourUsername. Just visit your profile to see your progress visualized with a heatmap!
What Makes the Rating-Based Heatmap Special?
Rating-Based Visualization: Each day is highlighted based on the difficulty of hardest problems solved, not just the count. Higher-rated problems result in richer, deeper colors.
Effort Recognition: Clearly see the amount of effort you put into your practice sessions.
Hover for Details: Want to know what you solved on a particular day? Simply hover over any cell to view the exact problems and their ratings. This makes it incredibly easy to spot the days when you tackled the hardest problems.
Stalk Your Friends' Progress Curious about how your friends are training? Check their Rating-Based Heatmap to understand the dedication behind their progress.
Color Mapping
The heatmap colors are based on the highest-rated problem solved on a given day. Here’s the rating-to-color mapping:
| Problem Rating Range | Color |
|---|---|
| 3000+ |  Dark Red |
| 2600-2999 |  Bright Red |
| 2400-2599 |  Light Red |
| 2300-2399 |  Orange |
| 2100-2299 |  Light Orange |
| 1900-2099 |  Purple |
| 1600-1899 |  Light Blue |
| 1400-1599 |  Aqua Green |
| 1200-1399 |  Green |
| 0-1199 |  Gray |
Features at a Glance
Accurate Rating Heatmap: The heatmap color on a given day represents the maximum rating of a problem solved that day.
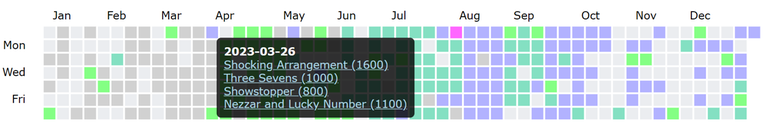
Quick Insights: Hovering over any day in the heatmap shows a tooltip with all problems solved on that day.
- The tooltip includes:
- Problem Name
- Problem Rating
- Direct Link to the Problem
Enhanced Motivation: Visualize your streaks and get a true sense of accomplishment.
Screenshots
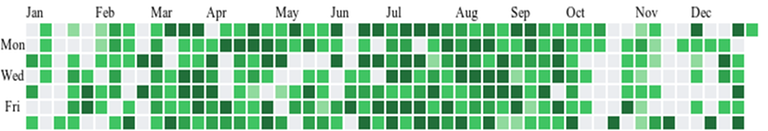
Default Codeforces Heatmap
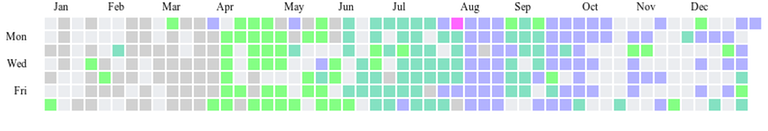
Rating-Based Heatmap
Rating-Based Heatmap with Hover Details
How to Get Started
Install the Codeforces Rating-Based Heatmap Extension from the Chrome Web Store.
Explore the code on GitHub.
Visit your Codeforces profile.
Watch your true efforts shine through the Rating-Based Heatmap!
Be Among the First to Try It
The Codeforces Rating-Based Heatmap Extension is now live, ready for you to experience a clearer view of your progress. Start using it today and see how your hard work translates into visible results.
True effort deserves true recognition. Experience it with the Codeforces Rating-Based Heatmap Extension!


Indians new cv content
I think the heatmap should be displayed for last one year until I make it for a specific year. I hope you will fix it.
Sure, got it! Similar to the codeforces one. I'll include this in the next update.
And another problem is, if I solve a problem which I solved before, it still colours the date. Hope you will make it similar to the codeforces one in this case also.
Great observation! It makes sense to prefer the first solved day since revisiting the same problems usually takes less effort, even though people might do it to try a different approach. While it's rare, I’ll fix this in the next update. Thanks for the feedback!
Wow, this is super cool! Finally, a heatmap that actually shows the effort, not just problem count. Definitely installing this — love the idea!
my coach: why did my li'le guys' heat map all turned gray?
lol
Bad news for self-deception enjoyers... Gotta find another way to fool the brain
What about Firefox?
Sure, I'm planning to add it on both Firefox and Edge soon!
You don't need to add it to Edge I think cuz edge supports all chrome extensions
Oh, that's good to know! Thanks!
good job, mate.
Pretty Cool
Great extension, could you make the default view to be past 365 days instead of 2025, like in cf heatmap.
Thanks for the suggestion! I'm working on it, and it'll be added in the next update soon!
Really cool extension
much needed extension, thanks for it