Background
I have recently stumbled across a paper which analyzed the correlation between the IMO medal and future success in the mathematical field. So, inspired by annual predictions of IOI rankings based on CF ratings, I don't know what to do with my time decided to take a more "serious" approach.
Method
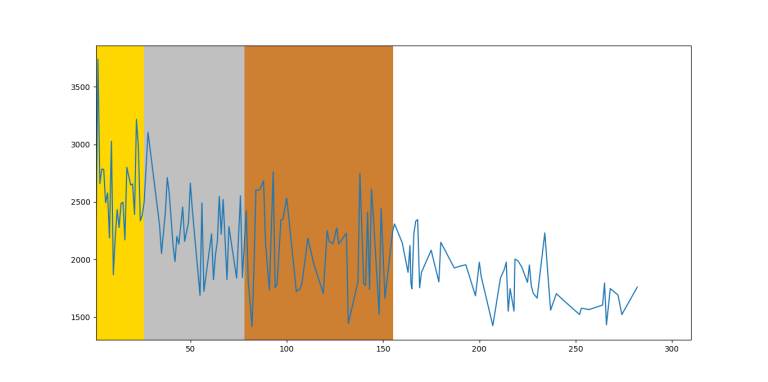
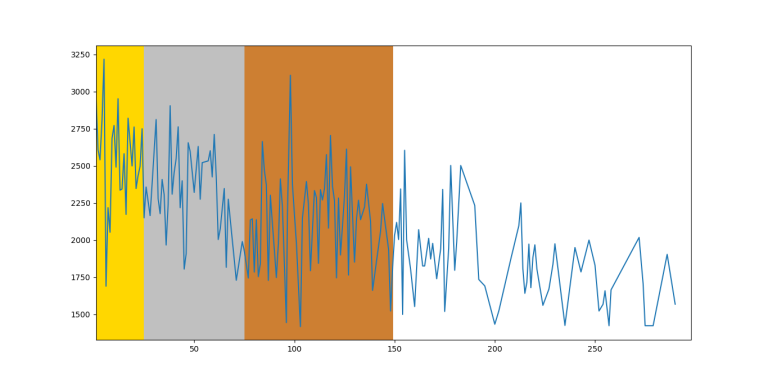
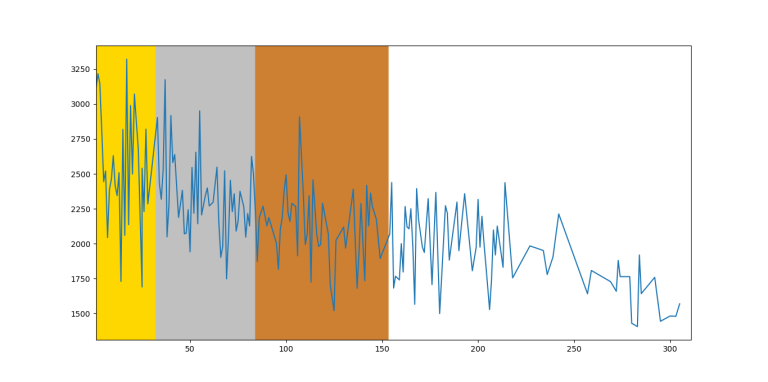
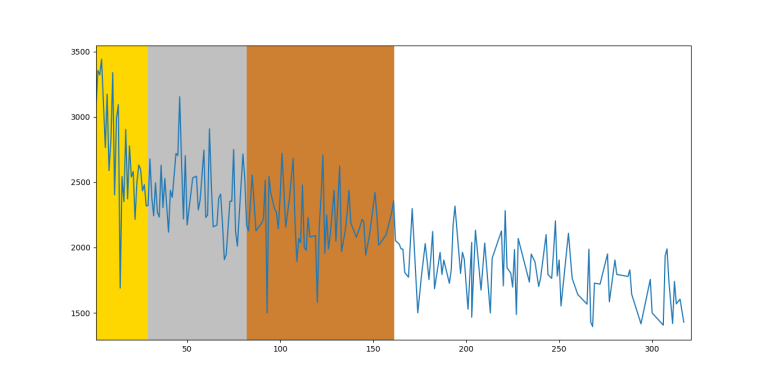
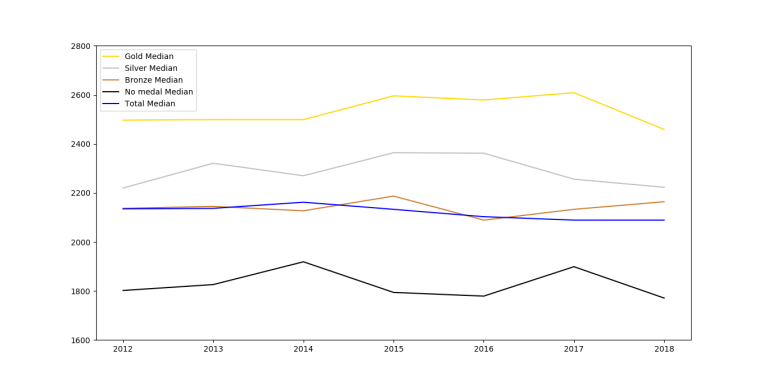
I collected the data from the last $$$7$$$ editions of IOI in order to create the graph of $$$f(x)$$$ is the maximal rating of the participant with rank $$$x$$$. For the last $$$6$$$ editions, I relied almost solely on the IOI statistics website. The $$$2012$$$ edition, however, is missing a lot of information and I collected the CF handles either from snarknews or by finding the handle on search engines.
I put the participants in the same order they were arranged in the scoreboard, so if there are multiple people on the same position, they would be assigned consecutive ranks. In case there was an unofficial participant, I assigned the mean of the ranks between which this participant was situated.
If there were participants with no competitions, I assigned the rating $$$1500$$$. This should not have big influence on the graph because there were very few such participants.
Things to consider:
A lot of participants from past editions don't participate in CF round anymore
The rating system has undergone inflation.
The rating system fluctuates too much.
The style/difficulty/originality of CF problems highly depends on the round and unlike the AtCoder case this creates disproportionality of rating distribution. So do the div 2/div 3/educational rounds.
Not everybody is active in CF rounds.
IOI 2012
IOI 2013
IOI 2014
IOI 2015
IOI 2016
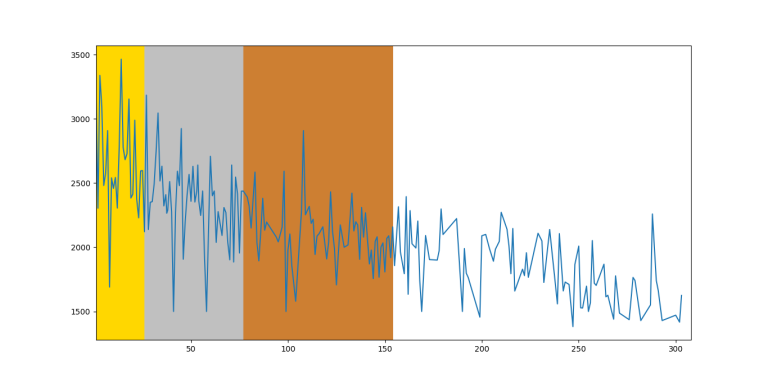
IOI 2017
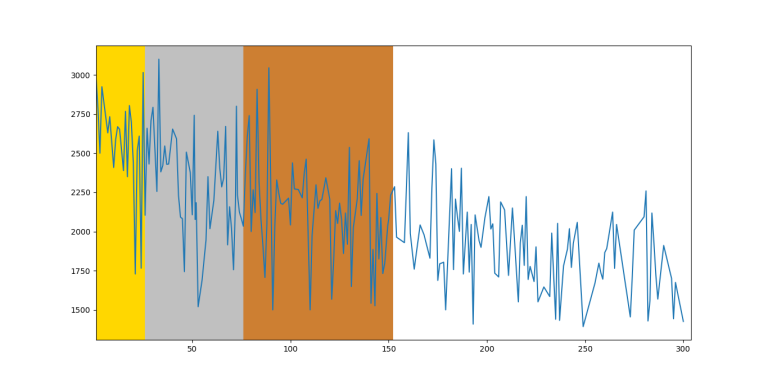
IOI 2018
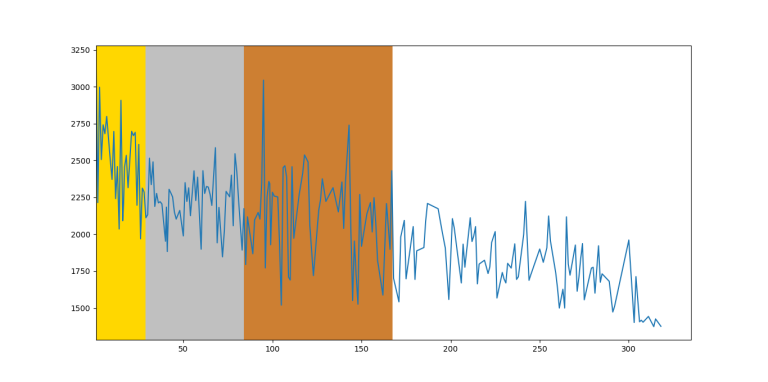
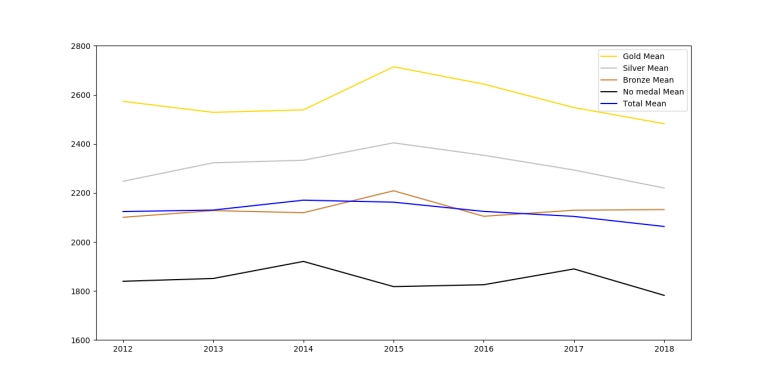
Conclusion
So, unsurprisingly, on average you can see that the function is decreasing by rank, however it fluctuates too much between close ranks. Therefore, on an individual level, you can't predict someone's future rating based on IOI ranking.
What do you think about this?


It's like comparing sprinters and stayers. On CF you should solve until the full solution but on IOI you can take a partial one. You can have only one full solution and take a Gold medal:
25 Daniil Smelskyi Ukraine 100 37 49 63 51 36
25 Joey Yu Canada 100 37 49 63 51 36
25 Mohammad Mahdavi Iran 100 37 49 63 51 36
Or have two full solutions and take a Bronze medal:
86 Martin Širokov Estonia 100 0 34 100 0 36
examples from IOI 2018
What if a partial solution can be a full one on CF? Usually, the setters consider the hardest version of the problem when proposing a round.
Maybe one could only able to solve A and B in some specific cf round, but get 75% of the points on C and 40% of the points on D (if those were partial score tasks). Then there's clearly a difference.
Yeah, but in most of the cases there is no way you would you would get partial points on a CF problem. You have either brute-force or you have the full solution, unlike on IOI where tasks are selected in such a way so that there will be multiple suboptimal solutions. For example, IOI 2015 towns is like literally two different problems combined and you would not see such a problem on CF. Also, CF usually doesn't distinguish close complexities like $$$O(N \log N)$$$, $$$O(N^{1.5})$$$ or $$$O(N \log ^2 N)$$$, so IOI 2016 railroad's solution will be something like brute-force — $$$O(N^2)$$$ solution — $$$O(N \log N)$$$ optimisation.
IOI is like marathon. Its hard to stay focus and acute for 5 hours straight. I usually get sleepy after 2 hours, maybe i do too much CF. Thats probably why some people cant perform well on IOI despite having high rating on CF.
For me it's the opposite, I fail to finish my solutions in 2 hours.
Therefore, on an individual level, you can't predict someone's future rating based on IOI ranking.
Of course you can't. At least not when we have people like matthew99 and geniucos
LOOOOL, I was waiting for you to write something
I think there's also a big impact coming from:
These two points are possible to cover, by going to more onsites when possible. So, if you have an opportunity to participate in some onsite round, you should grab it with both hands.