


Hello, Codeforcers!
I have recently launched a graph editor tool to illustration on vertex-edge graph editing. You may create and visualise your graph by simply stating the list of edges.
Highlight Features:
- Arranging graph as a tree/grid/circle
- Flipping, rotating or transpose the graph
- Zooming in/out
- Panning the view port
- Supporting both undirected and directed graph
- Importing/exporting as JSON
- Saving as SVG
- No limitation on the number of nodes
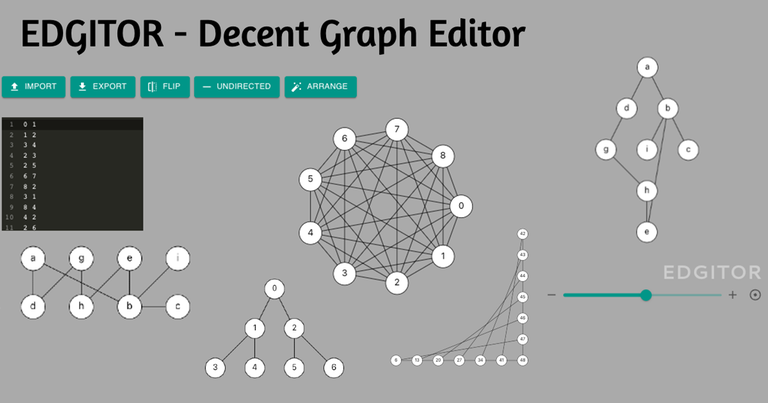
For any feedback, you may leave your comments here or leave comments in Github issues.


I don't know, but can it simplify the graph, rearrange the graph so that the edges do not cut the others ?
I can think of algorithm for planarity testihg, while no idea on how to construct it with given edges. Would you like to share any insight of it?
wow this looks really nice! nice job!
I prefer this.
https://csacademy.com/app/graph_editor/
Yes, it is definitely a great tool. I have used it over 4 years. However, I encounter several issues in my recent project, so I develop another one to fit my needs.
How do add vertexes, edges with mouse? It would be a great feature.
Looks very nice! However, there's a bug with adding edge weight where a new node is created with the label of an edge. Also, the background color makes it somewhat hard to see the edges.
Fixed. Cheers.