


I took every Codeforces user who (a) was rated 1400 or higher at some point in 2021 and (b) is still competing (active rated list, and at least one rated contest since 2025-01-01). That is 746 users. I pulled their full rating histories from the public Codeforces API and measured the cohort at each major AI release that mattered for competitive programming.
All numbers below come from user.ratedList and user.rating. Data was fetched on 2026-10-08. Charts and code are available on request.
Important caveat up front: this post shows what happened. It does not show why. Rating trends have many causes, and I mark clearly where I'm speculating.
How the cohort was built
user.ratedList?activeOnly=truereturned 43,131 active rated users.- I kept those registered by the end of 2021 whose max rating is ≥ 1400: 1,600 candidates.
- For each candidate I fetched
user.ratingand kept those whose rating was ≥ 1400 at any time in 2021 (including the rating carried over from 2020) and who competed since 2025-01-01. Result: 746 users. - For every checkpoint date I used each user's rating after their last rated contest on or before that date.
Segments by 2021 peak: 1400–1599 (211 users), 1600–1899 (222), 1900+ (313).
The checkpoints
| Date | Checkpoint |
|---|---|
| 2021-01-01 | Baseline |
| 2022-02-02 | AlphaCode (DeepMind announcement) |
| 2022-11-30 | ChatGPT launch |
| 2023-03-14 | GPT-4 |
| 2024-05-13 | GPT-4o |
| 2024-09-12 | o1-preview |
| 2024-12-05 | o1 |
| 2025-01-20 | DeepSeek-R1 |
| 2025-04-16 | o3 / o4-mini |
| 2025-08-07 | GPT-5 |
| 2025-09-17 | ICPC World Finals 2025: AI gold-level results |
| 2026-04-23 | GPT-5.5 (†) |
| 2026-07-24 | Claude Opus 5 (†) |
| 2026-09-22 | Opus 5.5 / GPT-6 (†) |
| 2026-10-08 | Now |
(†) 2026 dates come from third-party sources that disagreed with each other. Treat those lines as approximate.
1. The big picture: up until mid-2025, then down
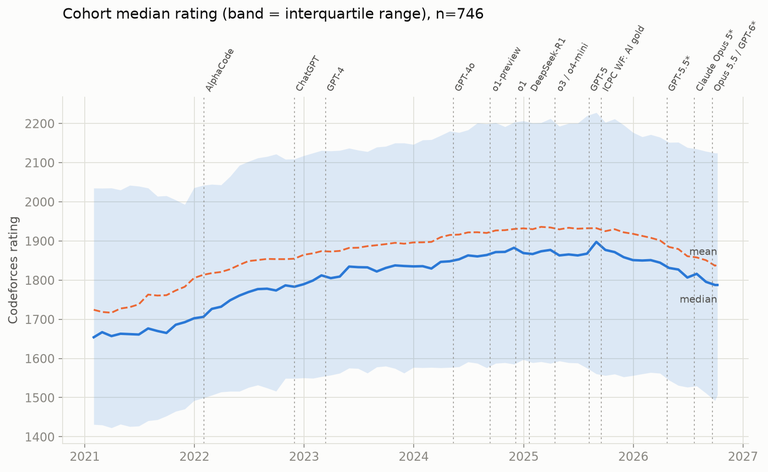
| Checkpoint | Rated | Mean | 25th pct | Median | 75th pct |
|---|---|---|---|---|---|
| 2021-01-01 | 628 | 1720 | 1430 | 1660 | 2022 |
| AlphaCode (2022-02) | 746 | 1815 | 1499 | 1713 | 2046 |
| ChatGPT (2022-11) | 746 | 1855 | 1549 | 1783 | 2109 |
| GPT-4 (2023-03) | 746 | 1870 | 1552 | 1804 | 2121 |
| GPT-4o (2024-05) | 746 | 1914 | 1577 | 1851 | 2174 |
| o1-preview (2024-09) | 746 | 1921 | 1582 | 1864 | 2199 |
| o1 (2024-12) | 746 | 1928 | 1578 | 1870 | 2198 |
| DeepSeek-R1 (2025-01) | 746 | 1932 | 1598 | 1866 | 2200 |
| o3 / o4-mini (2025-04) | 746 | 1931 | 1589 | 1866 | 2206 |
| GPT-5 (2025-08) | 746 | 1932 | 1566 | 1882 | 2218 |
| ICPC WF (2025-09) | 746 | 1931 | 1568 | 1872 | 2228 |
| GPT-5.5 (2026-04) † | 746 | 1890 | 1549 | 1831 | 2152 |
| Claude Opus 5 (2026-07) † | 746 | 1861 | 1534 | 1818 | 2138 |
| Opus 5.5 / GPT-6 (2026-09) † | 746 | 1838 | 1495 | 1779 | 2113 |
| Now (2026-10-08) | 746 | 1839 | 1507 | 1788 | 2124 |
(The baseline row has 628 users because the other 118 had no rating yet on 2021-01-01.)
- The cohort median rose about +210 points from Jan 2021 to its peak in Sep 2025 (1660 → 1872–1882).
- Since Sep 2025 the median has fallen about −85 points and the mean about −92.
- Today, 44.5% of the cohort are above their 2021-01-01 rating (median change vs. baseline: +25).
2. The rating bands
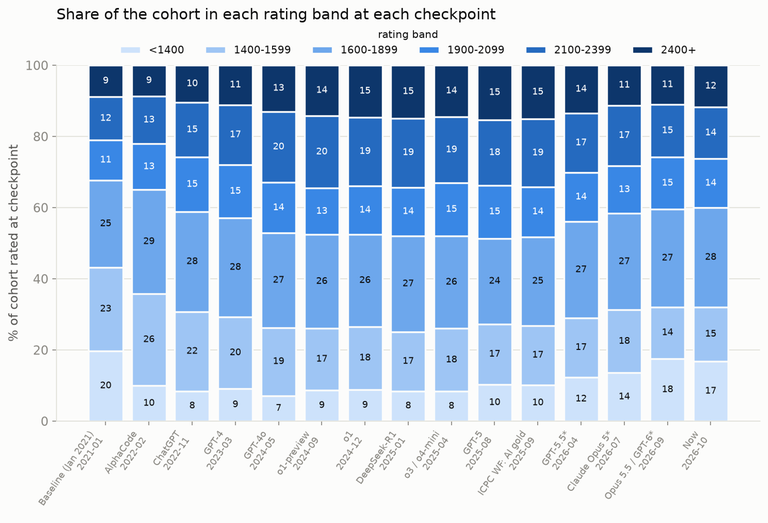
| Checkpoint | <1400 | 1400–1599 | 1600–1899 | 1900–2099 | 2100–2399 | 2400+ |
|---|---|---|---|---|---|---|
| 2021-01 | 19.7 | 23.4 | 24.5 | 11.3 | 12.1 | 8.9 |
| ChatGPT | 8.4 | 22.3 | 28.2 | 15.3 | 15.4 | 10.5 |
| o1-preview | 8.7 | 17.3 | 26.4 | 13.0 | 20.4 | 14.2 |
| GPT-5 | 10.3 | 16.9 | 24.1 | 14.9 | 18.4 | 15.4 |
| ICPC WF | 10.2 | 16.6 | 24.9 | 14.1 | 19.0 | 15.1 |
| Now | 16.8 | 15.3 | 27.9 | 13.8 | 14.5 | 11.8 |
The share rated 2400+ peaked at 15.4% (Aug 2025) and is now 11.8%. The share below 1400 has gone from 8.3% (Apr 2025) to 16.8%. Today 125 of the 746 users are below 1400, so "everyone above 1400" does not hold for this cohort any more.
3. Who moved, and when?
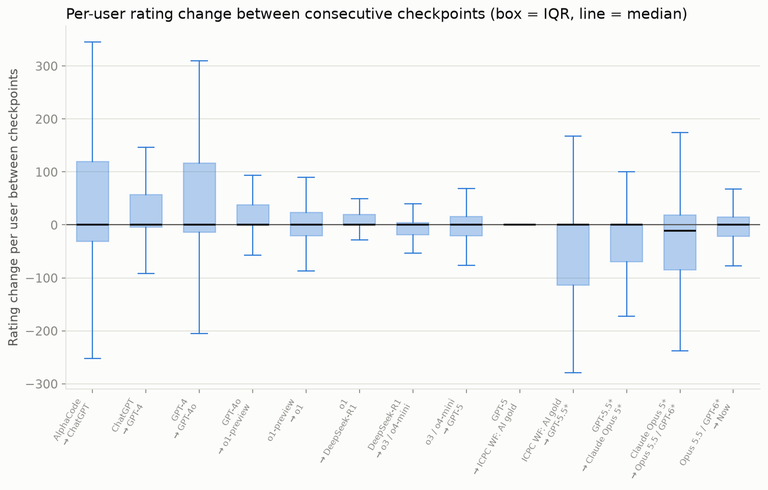
Between checkpoints, the median change per user is about zero. What changes is the spread and the skew:
- 2022–2024: wide boxes shifted upward. The top quarter of users gained about 120+ points between AlphaCode and ChatGPT, and again about 115+ between GPT-4 and GPT-4o.
- 2024-09 to 2025-08: boxes tighten around zero. Few big movers.
- 2025-09 onward: boxes shift downward. From the ICPC checkpoint to now, 71% of the cohort lost rating (28.7% gained, 0.4% unchanged), median change −96.
(The GPT-5 → ICPC box is flat because that window is only 41 days.)
4. By starting level
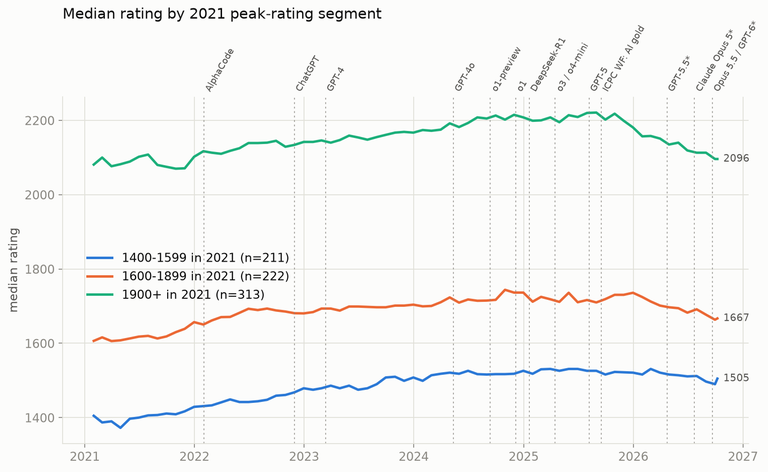
| 2021 peak segment | n | 2021-01 | ChatGPT | Peak era (ICPC WF) | Now |
|---|---|---|---|---|---|
| 1400–1599 | 211 | 1407 | 1468 | 1522 | 1505 |
| 1600–1899 | 222 | 1600 | 1681 | 1706 | 1667 |
| 1900+ | 313 | 2062 | 2134 | 2221 | 2096 |
All three segments follow the same shape: growth until about mid-2025, then decline. The decline is largest for the 1900+ segment (−125 median since Sep 2025) and smallest for 1400–1599 (−17).
5. Rating change per contest
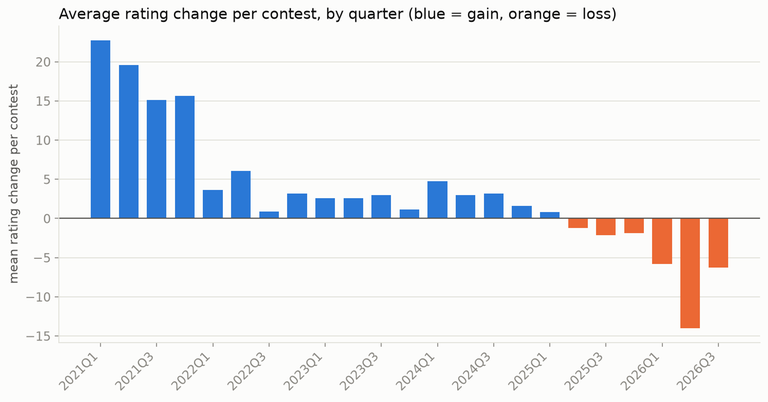
The average rating change per contest in this cohort was +15 to +23 in 2021, about +1 to +6 from 2022 to 2024, and has been negative since 2025 Q2, reaching −14 in 2026 Q2.
6. Participation
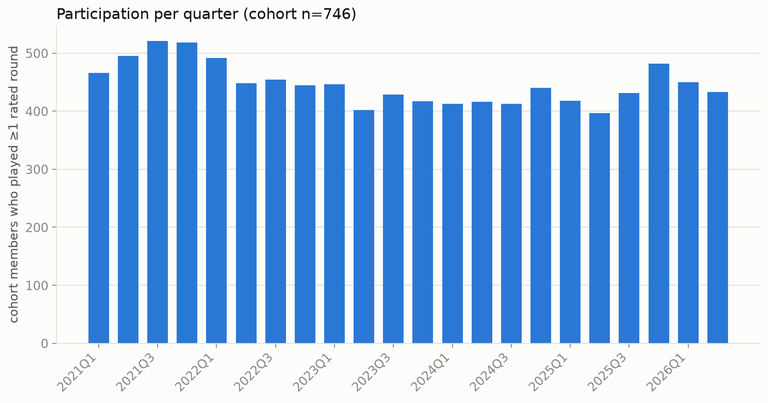
About 400–520 cohort members play at least one rated round per quarter. It peaked in 2021 (about 520), dropped to about 400–450 by 2022–2023, and has stayed in that range since, with no collapse in 2025–2026. The decline above is therefore not explained by the cohort playing less. (The 2026 Q3 bar is left out because the cohort was selected for current activity, which makes it 100% by construction.)
What I can and cannot claim
What the data supports
- This cohort improved steadily from 2021 to mid-2025 and has lost rating since.
- The loss is broad (71% of users), concentrated in the top segment, and shows up as a negative average change per contest.
- It is not driven by people playing less: participation has been steady since 2022.
What it does not show
- Causation. The timing overlaps with AI releases. It also overlaps with changes in the contest pool, new strong participants, rating-system effects, and changes in how people train. I cannot separate these.
- The whole population. The cohort only includes people who are still active. Everyone who quit after 2021 is missing, so this is survivorship-biased. The long-run average improvement is probably overstated.
- Regression to the mean. Selecting on "≥ 1400 in 2021" favors people at a local peak.
Any comments?
Tell me your opinion or anything you understand from these graphs
Here's the info for every user at every checkpoint: spreadsheet.
Data fetched 2026-10-08.