I have.
This Project was fully vibe-coded, I just wanted this graph, and I thought many other people would also.
https://github.com/quollcucumber/fullgraph/tree/main
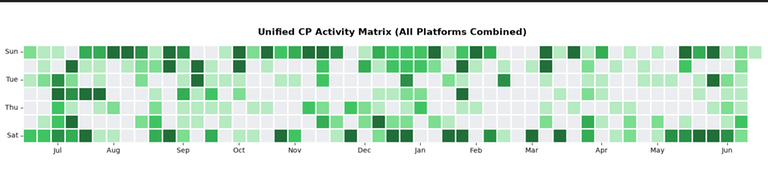
What this does, is it displays a graph of how much you've been training over the last year. It combines many different platforms. Mainly:
Codeforces
Atcoder
DMOJ
OJ.US
Leetcode
Orac2.info (niche Australian OI training)
To use this tool, simply replace the usernames at the bottom with your own. (lines 288 — 293). Say your handle was tourist, you would replace it with:
"cf": "tourist",
"atcoder": "tourist",
"dmoj": "tourist",
"ojuz": "tourist",
"leetcode": "",
"orac": False
If you don't have a specific account on one of these, simply leave it blank.
To run it, download the appropriate python files with pip install matplotlib numpy pandas requests seaborn beautifulsoup4
And then simply run the file, and it should display the graph.
If you are in the group of like 10 people who actually have an orac2.info account:
(steps for firefox, I presume other browsers are similar)
- Log into your orac acount
- Go to https://orac2.info/hub/allsubs/1
- Click f12/inspect(Q)
- Go to the storage tab
- Copy the value in SessionId, Value
- Change line 15 to what is intuitive.
- Run
(Running it takes ages, often ~30 seconds, so be patient)
If you've never used/even heard of orac2.info, you should make an account, it's got lots of amazing problems!
Here's my graph: