


Hey everyone, IOI2026 is over! Congratulations to everyone who participated for their hard efforts. While all the contestants were struggling to solve the problems, I had some free time so I looked into some stats.
Some notes before we get into things:
- It is entirely possible that some of these are wrong/incomplete/misleading. I only made these to satisfy my own curiosity, and they are not an authoritative source
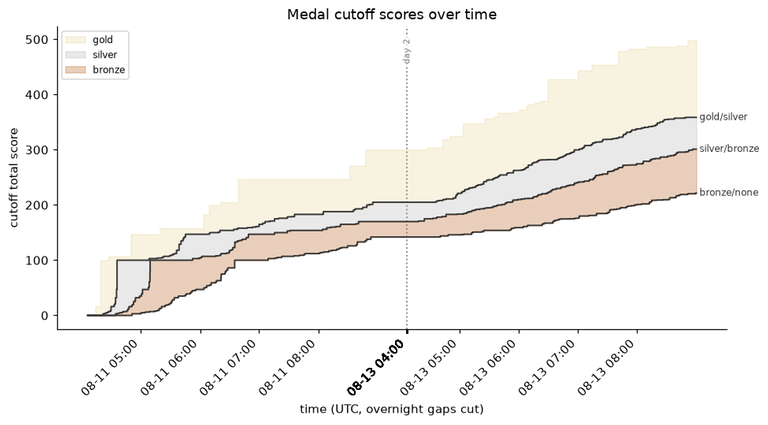
- I expect this to be particularly true for medal cutoffs, where I have not accounted for unofficial contestants Thanks to all the organizers for making IOI2026 a great event! I try to break them down by category so that this blog doesn’t get too long:
IOI vs Codeforces
This has been well researched before, (here, here, here, here, and here and possibly in other blogs as well). Therefore it is no surprise that even if CF and IOI have different formats, performance is to a large extent correlated:

(unfortunately I couldn’t find the CF handles of all IOI participants, which might also be skewing the results. I’ve mostly used the IOI 2026 teams blog and IOI Statistics, and it’s also possible that I’ve made some misclassifications, since I mostly used AI to match names in the blog post to IOI contestant IDs)
But there’s some more interesting questions we can ask:
Are some problems more CF-like than others?
Of course, not all problems are created equal. Particularly, IOI 2026 had a few “communication” tasks, which are not common in codeforces. In those tasks, the contestant needs to implement two separate programs which can’t communicate with each other, to implement e.g. some game strategy with limited information.
So here’s the per-task score
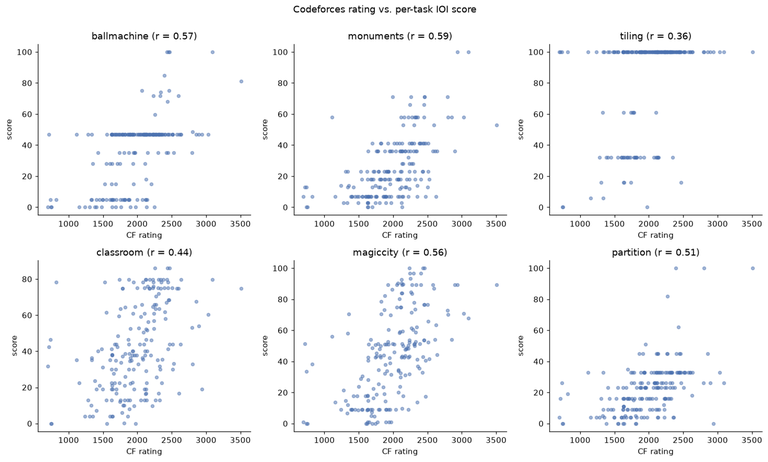
The communication tasks were classroom and partition. ballmachine was also interactive, but much closer to CF-style interactive problems where you make some queries, and land on a solution based on the answers to your queries.
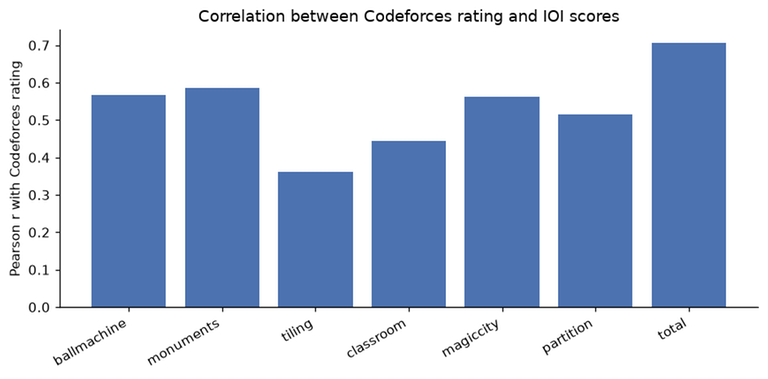
Some comments:
- It is quite interesting to see that the total score is more correlated to CF rating than any individual task, since the increased number of tasks (and possible total scores) takes some of the luck aspects out of the equation.
- Tiling was a slight exception in that it was significantly easier to solve for 100pts than the other problems, so ~⅔ of the people solved it for 100pts, so the correlation was brought down by relatively strong contestants who didn’t solve it fully (e.g. because they were stressed and overcomplicating it, or because they didn’t spend enough time on it, or they just got unlucky, etc, not necessarily because they coudln’t).
- Particularly for tiling, I expect the lack of CF usernames on the lower-end of the scoreboard to have skewed the results
Score distribution
Another interesting aspect is how the score is distributed. When I am part of scientific committees for different competitions, my target is to have scores be close to uniform. Ideally, we don’t want many people getting 0 or the max score, and we want to maximise the distance between people as much as possible.

While not uniform across the 0-600 scores, it looks relatively uniform between 10-350 points, which I think is a great feat of the scientific committee. Thanks for all the hard work!
However, the individual days on their own were not as balanced:

Day 1 had a very large proportion of scores between 100-200pts, and on day 2 most people had 0-150pts, but when combined together that kind of balances out!
A common oddity in olympiads is that competitions usually have 2 contest days. Why do we need 2 days? Wouldn’t people who are good already do well on both days, and people who are weaker do worse on both days? While this is mostly true, there’s still a lot of luck-based elements in a contestant’s score. These can include:
- How well a problem aligns with the contestant’s knowledge/experience
- Outside factors (e.g. didn’t sleep well the night before, or feeling sick)
- Motivation
Because of these, the day 1 and day 2 rankings are not perfectly correlated. There were both people who did better on day 1 and people who did better on day 2:
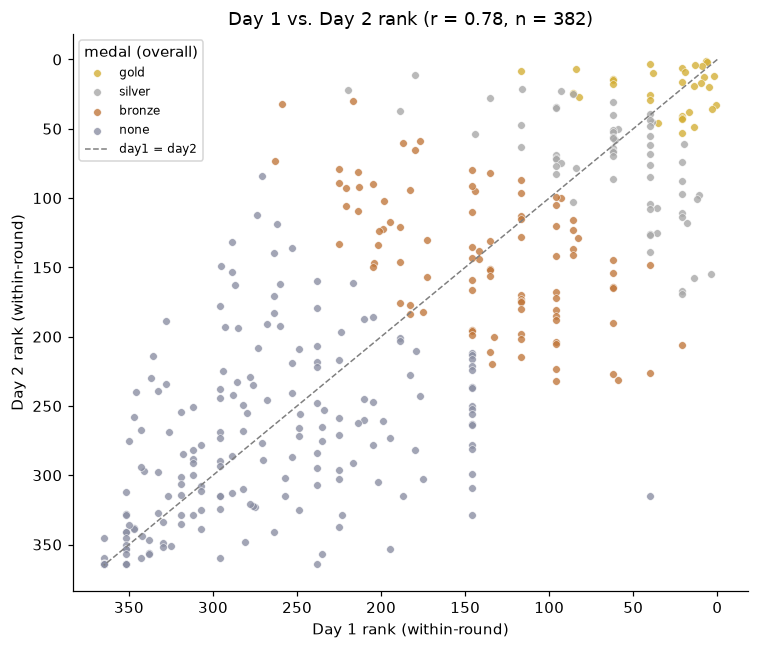
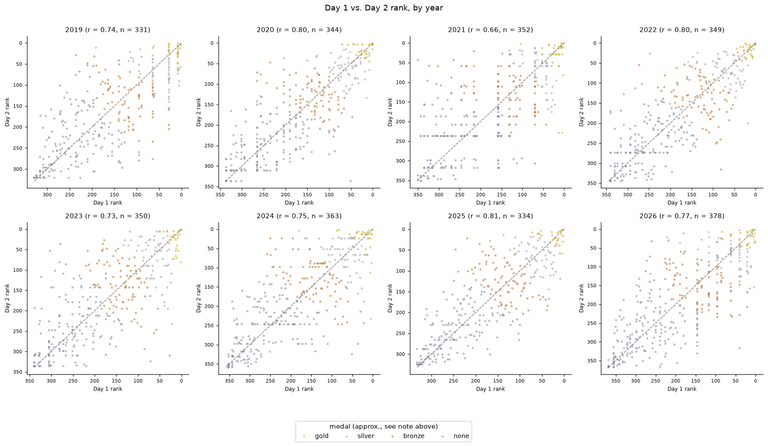
This has been quite similar for the past few years (perhaps this is even more true for 2021, where we can see a very large number of outliers between day 1 and day 2 ranks):
Problems
Individual problem score distribution
Obviously we can’t expect the distribution of problems to be uniform, since problems have different difficulties, and hence the distribution will be less uniform:

Nevertheless, I am surprised at how uniform the scores in classroom and magiccity were (you might expect that this is easy to achieve for problems with partial scoring, but there’s usually a relatively small number of solutions/strategies you can reasonably come up with, and implementation details usually don't influence the score that much).
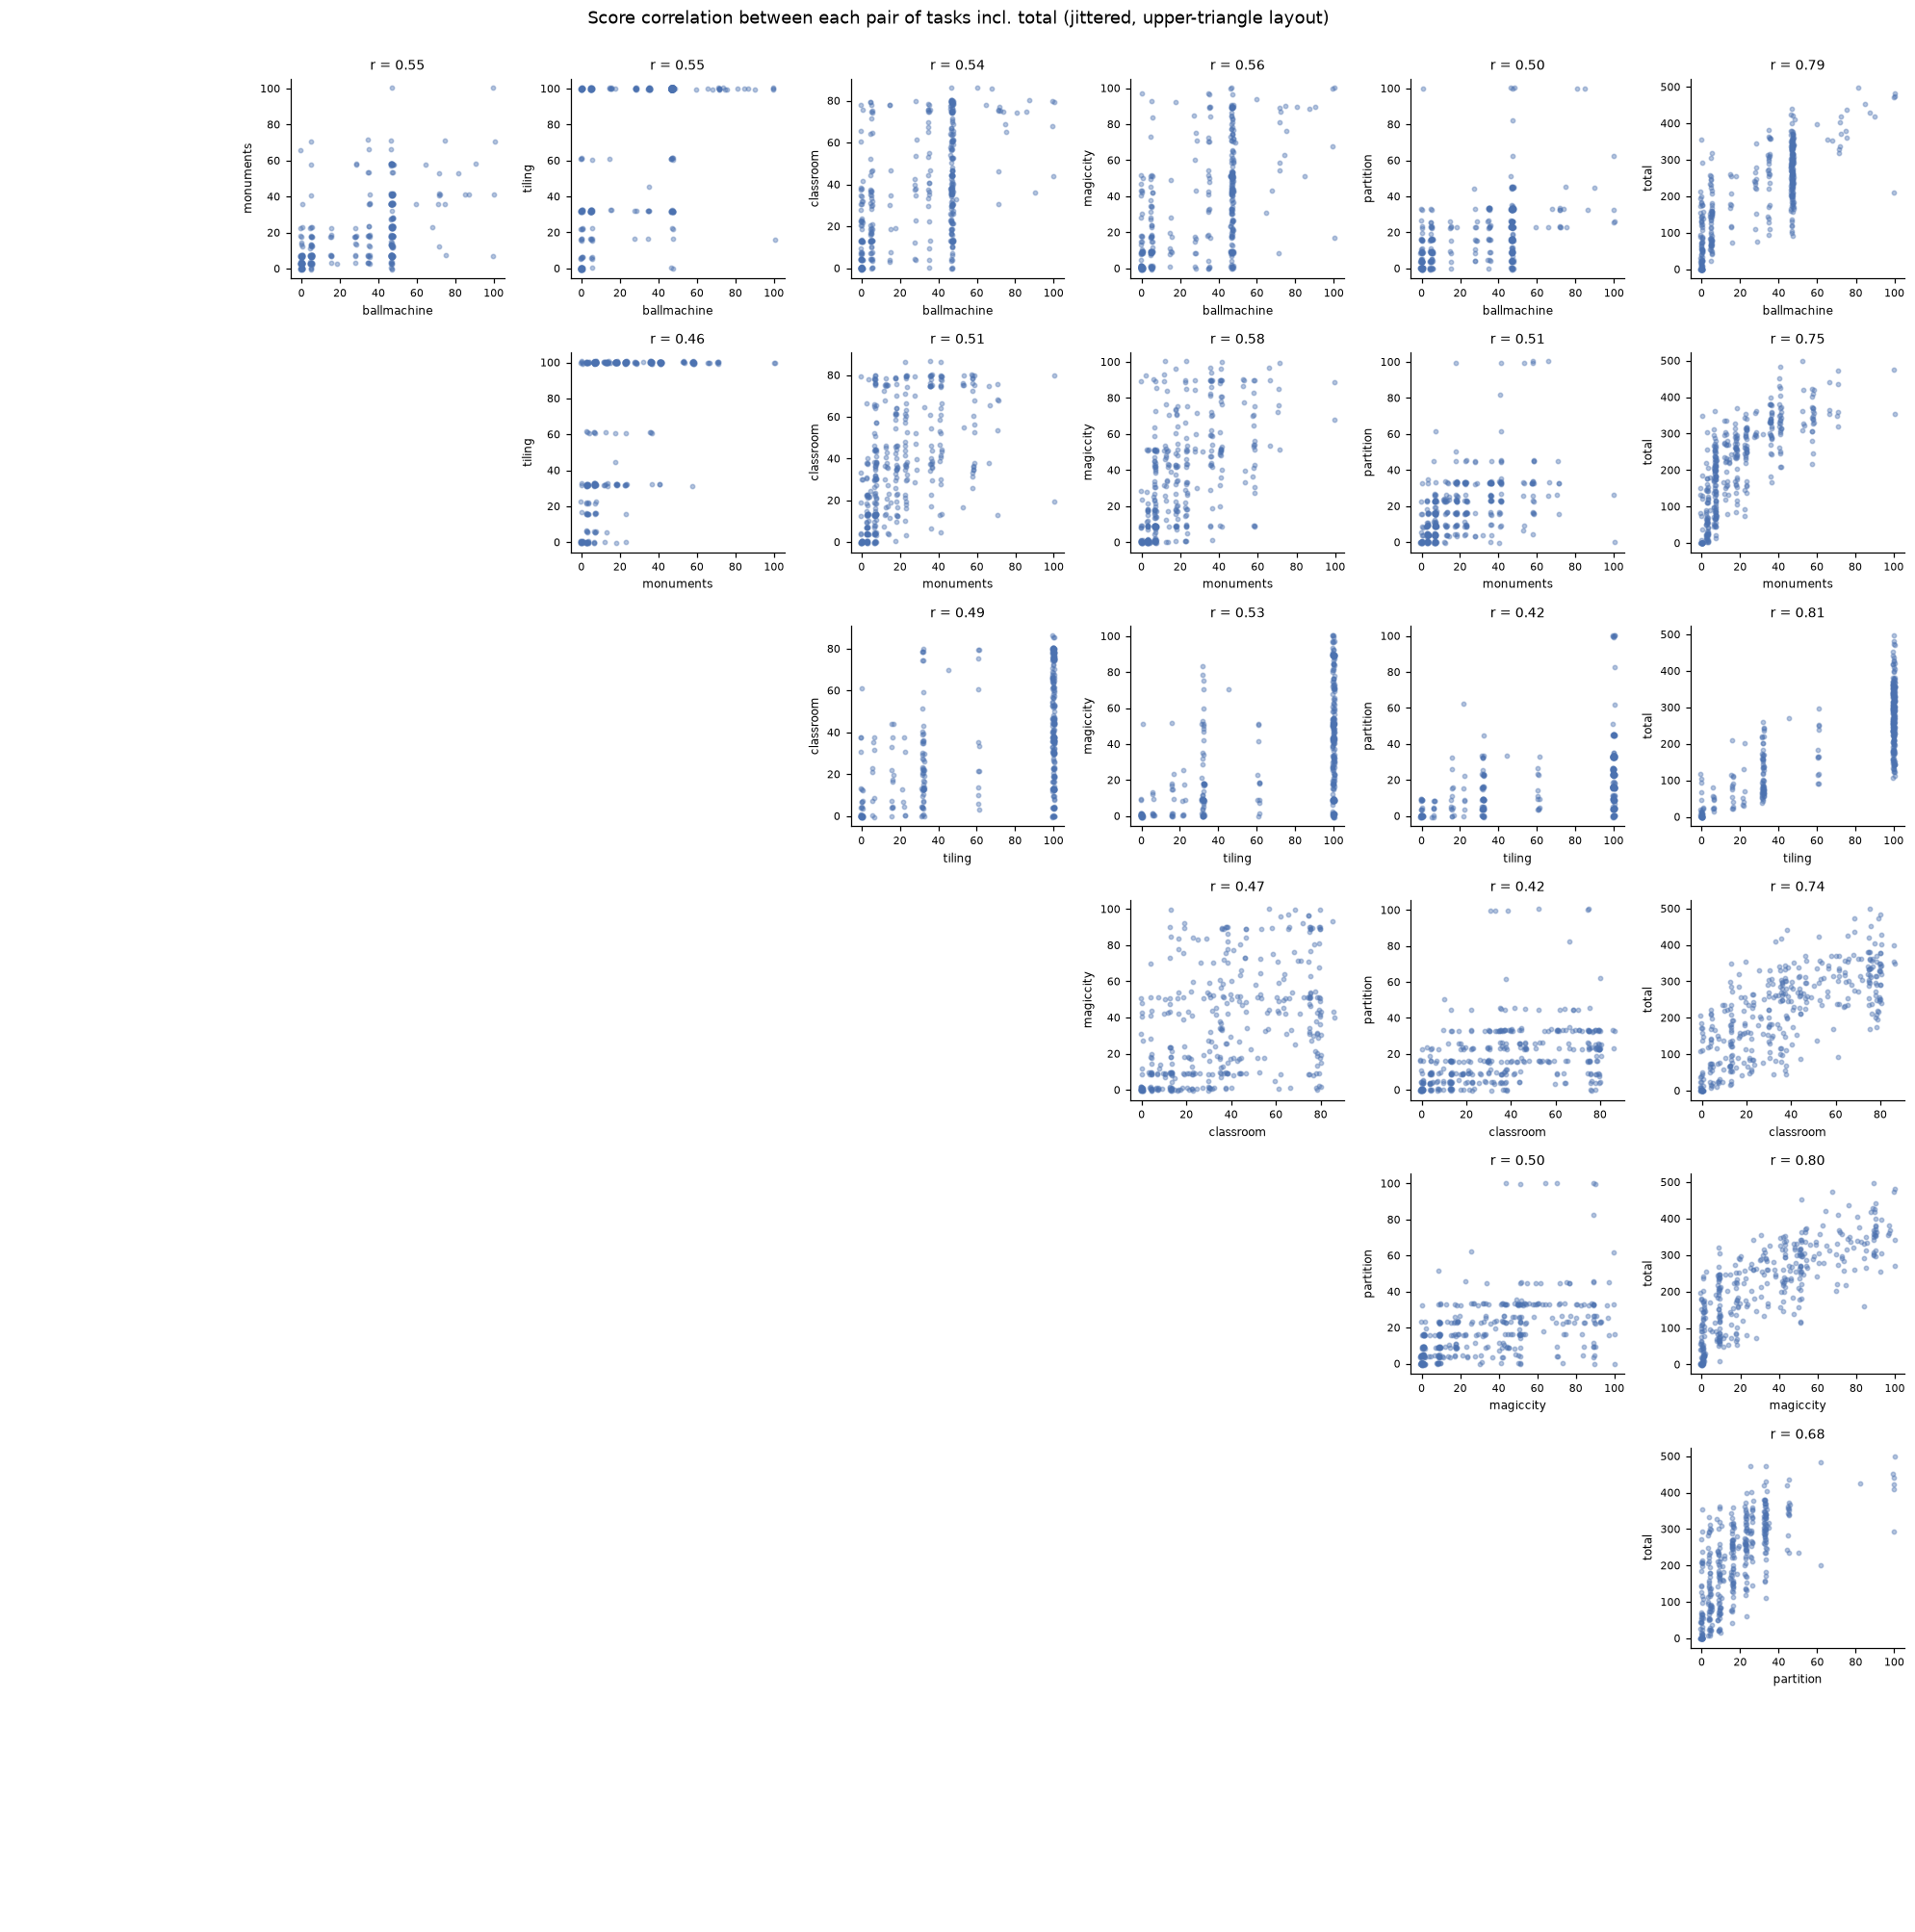
On a similar vein, one can ask: are the problems that different? To what extent will contestants who do well on one task also do well in another?
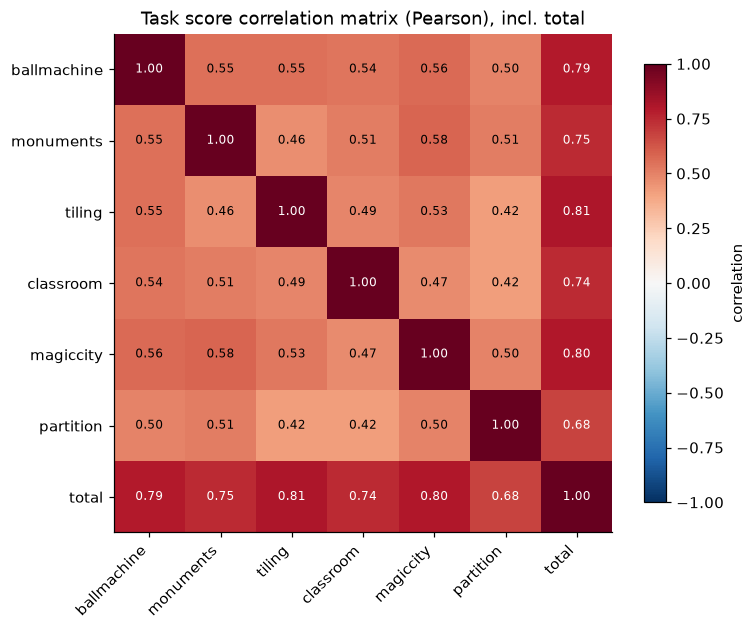
You can see the actual plots instead of just the correlation here. I claim that this is slightly misleading (at least for pairings of problems on the same contest day). The above graphs conflate these two things: - A strong contestant gets lots of points of problem X quickly, so will move on to problem Y quickly and get more points on problem Y as well (suggesting some positive correlation between the problem scores) - However, the story might be different for a weaker contestant. Contestants have a limited amount of time which needs to be distributed between problems. Therefore, it’s probably reasonable to not just spend 5hours/3=100minutes per task, and instead spend some more time on the task where you feel like you’re more likely to get more points. Therefore, this contestant might have spent more time on problem X, which means they have less time to spend on problem Y, and therefore get less points on problem Y, which would suggest some negative correlation between the problem scores.
Therefore, perhaps it doesn’t make too much sense to compare problems directly, and instead calculate some sort of partial correlation, by controlling for a common “skill” factor. Depending on the skill factor chosen, we see a statistically significant decrease in per-problem correlation, meaning that at least to some extent we do see the “time-tradeoff effect” explained.

This supports my hypothesis to some extent, but I’m not sure how sound it is. If you have any ideas for a better way to model this, please let me know in the comments!
Progression on the contest days
Do people gain points at the same rate at the beginning of the contest vs the end of the contest? I think in a perfectly balanced contest, you’d want this to be approximately true, where stronger contestants make progress (i.e. get points) faster, but don’t run out of things to do, so their “rate of gaining points” is roughly constant, and similarly for weaker contestants.
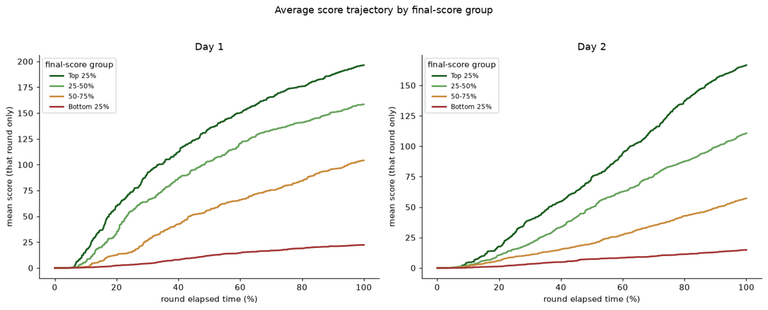
As we can see, on day 1, contestants get a lot of points quickly, but their score plateaus towards the end of the contest, whereas for day 2 this appears to be a lot closer to linear, without much plateauing, except for the very strong contestants getting gold medals.
Preferences in problem difficulty
Some contestants claim things like “I’m generally doing better at harder tasks”. Is this actually true? The problem with being good at harder tasks, is that the “ceiling” for the number of points you can get is lower (assuming that you can get 70pts on the easier task, being in the 30th percentile when everyone else gets 100pts, while also getting 50pts on a harder task, being in the top percentile for that problem).
What would the look like if people who solved the harder tasks were awarded more for it compared to solving easier subtasks? I try to model this in two separate ways:
- Instead of adding up the score of each problem to get a total score, instead convert scores to percentiles for each task, and use those as the scores for the task:
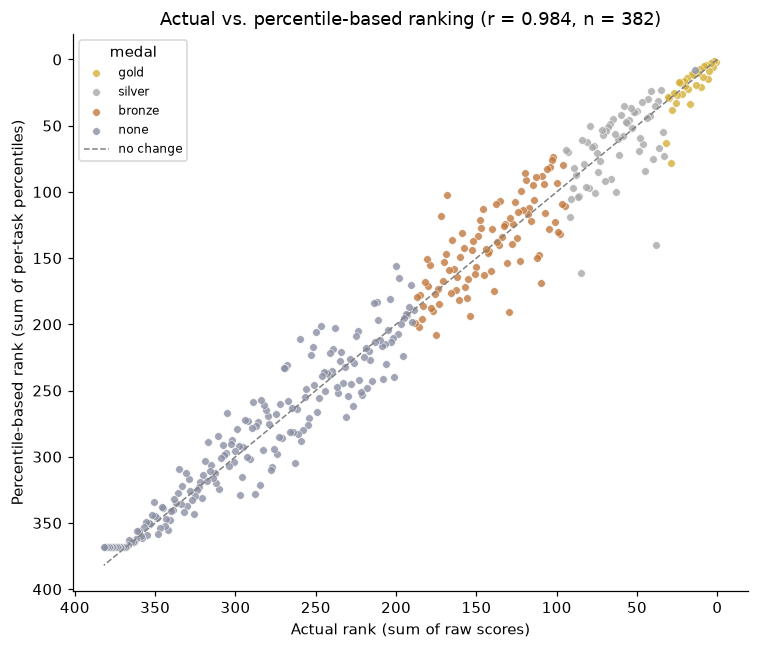
There is a lot of correlation here, but the points furthest from the line are in the opposite direction, i.e. using the percentile-based ranking causes them to drop a lot of places in the rankings. My interpretation of this is as follows: Consider a problem where 95% of contestants scored <40% on. Someone in the top 5% for that problem could’ve scored 100pts, getting 2.5x the score of the majority of the participants. However, with the percentile-based scoring they would only get ~5% more (i.e. close to 100pts instead of close to 95pts). - To account for the above, we can use a slightly different model instead, by using z-scores (i.e. how many standard deviations above the mean each score is)
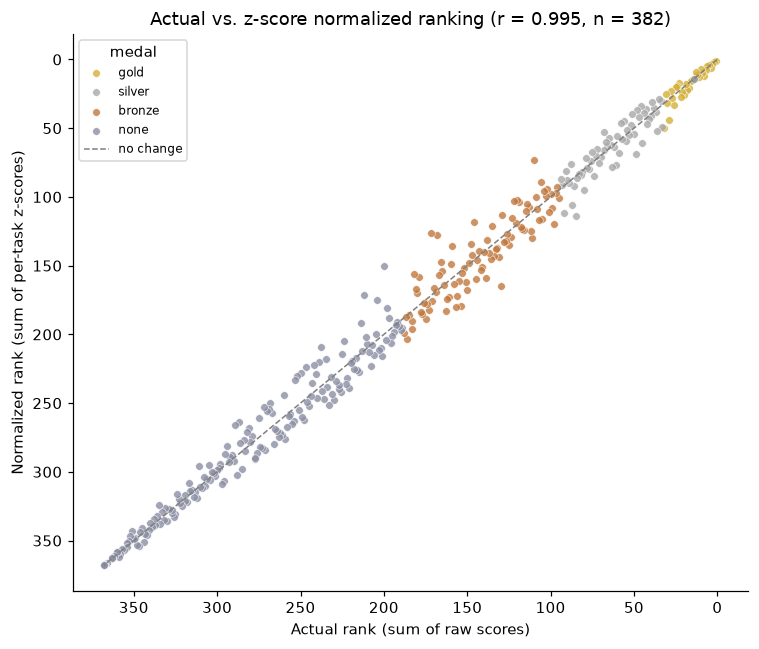
Here, we don’t see such big swings, and there are quite a few people who do better with this normalized score (but of course some people do worse). Looking at specific examples, this is e.g. because they didn’t get 100pts on tiling, but did very well on the harder tasks.
There’s a lot of data to be looked at from the IOI, and this is just scratching the surface! If you have any ideas on what would be interesting to look into next I’m all ears (particularly connecting multiple data sources together) let me know!


GomerDoGo we are NOT losing good blogs.
goated blog :) congrats to everyone who got a medal!!
Nice analysis! One thought: The correlations between CF and IOI strike as very low to me. Maybe we can compare with CF rating <-> problem ABCDEF in div1/2 as a comparison? Maybe it’s just very high variance anyway and comparing gives us a better idea.
Hmmm maybe this will become the next useless blog topic
Cool, nice blog!
Thanks for sharing. It provided me with some fun during my layover.
I have a quick question: Which rating do you use to make these graphs, the current or maximum?
The graph in the blog is using current CF ratings, here's one with max rating instead (also including the line of best fit)
If you want to see any of the other graphs based on max rating let me know!
It would be interesting to see how cf rating correlates with a specific CF contest.
woahhh jason orzz
I wish one day i can take part in IOI and be up there with the greatest... Gotta trust the proccess for now tho...
If we did a line of best fit on the CF versus IOI dataset at what CF ratings would the line hit bronze, silver, and gold?
If I'm not mistaken, it's around 1950 for bronze, 2350 for silver, and 2650 for gold when using max CF ratings, and 1850/2250/2550 when using current CF rating (both are after excluding a few outliers to get the line of best fit to match a bit better).
The equations were
ioi_score = 0.182 * max_cf_rating - 122.7, andioi_score = 0.192 * cf_rating - 128.8respectively.Why are players with CF ratings greater than 3000 not included in the chart?
Sorry about that, the China team wasn't posted as a comment in the teams blog post (and sanctioned teams were also not handled correctly), so my original script couldn't match them correctly. I've now added them manually, and also improved matching so that there's also another ~30 usernames matched. I updated the graphs in the blog post, sorry for the confusion.
My teammates DnlPrs809 and Davdav1232 got 10th place and 14th place respectively!
A bit of a troll on the stats (obviously we don't do CF) :)
Just curious, What sources did you guys used to prepare??
Israel has an excellent year round program.
We have ~70 students divided into 2 groups, beginner and advanced, with ~15 people in the advanced group from which we choose the delegation. Because Israel is so small, we can meet every week or 2 weeks for a 5 hour simulation and a lecture. According to the results of the simulations done all year, the coaches choose the delegation.
Obviously it is not enough and it is expected that the students do more at home. I can say a lot of us do high quality contest simulations (like APIO, BOI, and JOI), and we save recent years IOIs to simulate in the couple of months between the announcement of the delegation and the IOI itself. Also it is standard practice for students to become coaches when they finish 12th grade.
I personally don't agree with the statement that CF helps at OI, I think it's mainly correlation. Solving a lot of questions obviously helps a lot, but I don't think that participating at CF contests helps. OI questions are different than CF ones, and the strategy involved in OI is different than the one in CF.
"When I am part of scientific committees for different competitions, my target is to have scores be close to uniform."
Eh. Having scores be close to uniform is certainly among the more decent possible outcomes but it shouldn't be the ideal goal state, and in general I don't think it's a helpful thing to focus on when setting problems for a contest.
Every competition has its own goals. When you're on a scientific committee, you should be aware of what those goals are, and then set the problems in a way that helps you reach those goals as reliably as possible (given all the obvious caveats such as "you have just a limited number of problem proposals to choose from"). The optimal composition of a problem set depends on many things. The distribution of skill levels of your contestants is one of the major ones, but so are the goals I just mentioned.
To give you a few simple ideas and examples behind this:
To put a more complicated idea very simply, a subtask of an IOI task -- or in general any exam question -- gives you the most information about the people whose skill levels are around the question's difficulty level. E.g., consider that you have a classroom and you give them a test. If the whole test is too easy for them, you aren't going to learn anything about their respective skill levels: everybody will solve everything, minus some mostly-random noise. If the whole test is too hard, you are also not learning anything from a bunch of zeros.
There is a whole lot of actual math/stats theory behind these things. Google "item response theory" as a starting point that's relevant to settings like math or competitive programming competitions.
An example goal when setting a contest: Suppose the contest is a round of a national olympiad. Its purpose is to select the 40 kids out of 400 that will be invited to the finals. What should an optimal problem set look like? If you are just aiming to have all the scores roughly uniformly distributed, you are wasting a lot of the problem set on parts of the ranklist that don't actually matter in terms of the main goal. At this stage you don't need almost any information on the top of the ranklist, and you also don't need any information on its bottom. What you need is as much information as you can about the skill levels of contestants who are around the cutoff point. If you set the problems accordingly, this will give you a problem set where you'll get a bunch of full-ACs on the top and a bunch of zeros on the bottom, but in terms of achieving the main goal both of these are actually good things. Yes you now have very little information about the relative skill levels of your top 10, but you shouldn't care about that at this point: you know the relevant thing about them (their skill levels are all significantly higher than the skill level of the 40th-place contestant with a very high probability, so they all should advance, and indeed, they all very comfortably advanced) and you didn't waste a part of the problem set on problems that nobody around the 40th place could solve => tell you nothing about who among those participants is better.
If there are separate prizes awarded to the best participants in the round (e.g., the best one in each of the country's regions), you might also have a secondary goal of identifying those, and you can achieve that by making the top end of the problem set somewhat harder -- i.e., including subtasks whose difficulty more closely matches the subset of participants who have a realistic chance to compete for those prizes. And so on.
Setting problems for the IOI or a similar competition is fairly tricky because of the many different and often somewhat competing goals, but generally the main three goals that the scientific committee always keeps in mind are the obvious ones: the medal boundaries. The primary goal of an IOI problem set isn't to give you uniformly distributed scores. It is to determine the medal boundaries with the highest available degree of certainty.
Do you think you were successful this year? I believe day1 was really badly distributed, and day2 had so many constructive and communication ideas (which means bad I believe because with that only a small part of the problems, which have mostly similar ideas, decided medals). As you can see the differences between medals are slightly less this year. Briefly, yes I loved some of problems so much, but I believe the distribution needs to be more accurate.
I mostly agree that it's not as simple as "we want everything to be uniform", but I think it's a good rule of thumb. The reason I think this is the case is that it manages a few different goals:
And I definitely agree that coming up with balanced problemsets for IOI-style competitions is hard, especially with the small number of problems available, especially in cases where you don't have an extremely good sense of the skill level distribution of contestants (I think it seems reasonable to model the contest/tasks as a transformation of the skill level distribution to the target score distribution, whatever that is).
Where are Legendary Grandmasters?
Added now! See this comment for details
Really cool blog! cfalas orz