


Alright, clickbait title aside, how do tourist and jiangly get to 4000 rating? In chess, real life ratings cap out at around 2900, and even on online sites like Lichess, the highest bullet players are 3300-3400, and just around 3000 for the other modes.
Also, anecdotally, if rating is correct, the model predicts that someone who is 2940 should beat me 99.1% of the time. I have a gut feeling I beat more than 0.9% of GMs and LGMs in round 1105 and round 1108.
The mechanistic explanation
Okay, let me explain two reasons that could potentially cause this and why this isn't pure cope.
1. Event variance
A 400 higher rating implies a 10x higher chance to win a game. But what is a "game"?
Suppose I have created a game called "Super-Chess" where you play best 2 out of 3. Assume for simplicity that there are no draws. If A is rated 400 higher than B, then A should win $$$\frac{10}{11}$$$ of the time against B in a single game. But in a round of 3 game of "Super-Chess", A's win chance is actually
So, in "Super-Chess", A would be rated about 649 points higher (because $$$\sigma(649/\beta) = 0.9767$$$), instead of 400.
The main point here is that if a "game" has less variance, then ratings will be stretched out more. In the case of Codeforces, a "game" is an entire contest, which contains multiple problems. So this can serve to reduce variance and stretch the ratings out a bit more.
2. (What we're going to investigate today) Flawed rating calculation
According to Mike's blog, the rating delta is half of the difference between (old rating) and (performance of the place that is the geometric mean between the expected place and actual place).
This calculation might be biased upwards, since by AM-GM the geometric mean is always smaller than the arithmetic mean. Also, near the top of the leaderboard, this difference can be dramatic, since performance can change by 50-100 by moving a single place.
Methodology
We will sample a few div1 or div1+2 rounds (and we're doing both modern and pre-AI rounds for fun). For each one, we'll run simulations of a user with rating $$$r$$$:
- Use code I already wrote for the old "are div1 ratings harder" blog to calculate the performance of each placing
- Calculate this user's expected placing if their rating is $$$r$$$
- Simulate the user's actual placing by just randomly rolling 0/1 for each participant. This should, at least in theory, model a realistic perf that the user gets.
- Calculate the delta if they got this placing in round, and calculate the expected value over many trials (1000 per rating per contest).
We'll then aggregate total values and see if there are differences in the expected rating change if you are of different ratings.
Results
Here's your high-res graph again:
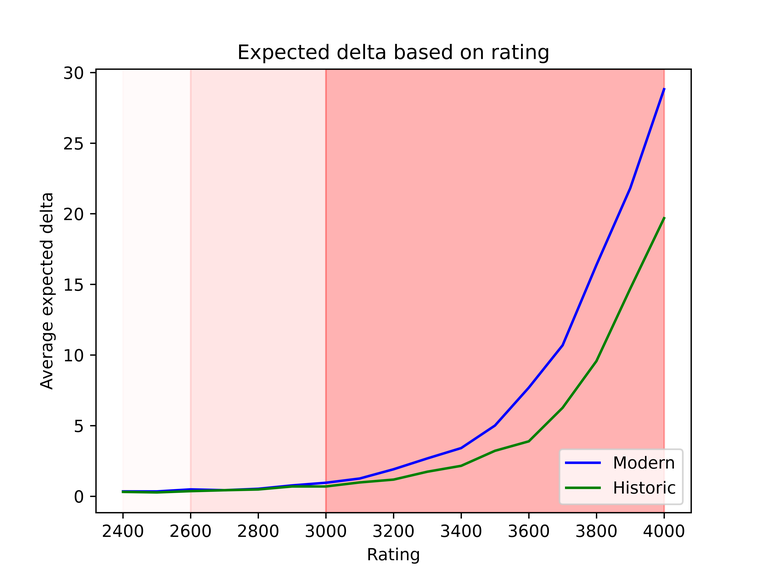
The relation is almost perfectly exponential — it turns into a line when you change the Y to a log scale. If you're 3600, you could be earning 5-10 undeserved points of delta every contest! But if you're 3000 or below, you get less than a point.
Does this actually affect us in real life?
These differences don't seem to be big enough to matter.
- If your rating is 3500, you can maintain it with around 3480 level skill.
- If your rating is 3400, you can maintain it with around 3385 level skill.
That seems inconsequential.
So this blog is complete cope. Unless...
Community simulation
It's possible that the high rated LGMs can pull each other up. Rating is relative — if Mike manually added 300 rating to every LGM, and they only did div0s with each other, their inflated ratings would stay.
But is this a big enough effect in practice? Could the LGMs keep their inflated ratings without leaking them back to everyone else? Let's simulate again.
Methods
We simulate all div1 players, with their ratings rounded down to the nearest 50 just to make things a bit easier. The playerbase looks like:
{3750: 1, 3700: 1, 3650: 2, 3600: 1, 3550: 2, 3500: 1, 3400: 2, 3350: 4, 3300: 3, ..., 2100: 993, 2050: 357, 2000: 531, 1950: 765, 1900: 1165}
We'll initialize each player with their real rating / their actual skill, and nominal rating / CF rating. For example, Benq becomes a Player(real_rating=3750, rating=3750).
We simulated 200 trials, each of 100 contests in sequence. After each contest, nominal ratings are updated, but we assume their true ratings/skills do not change.
Results
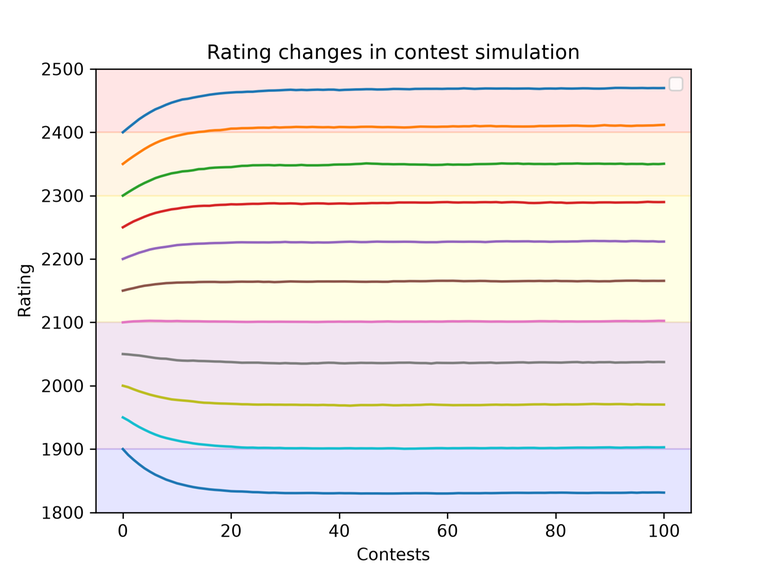
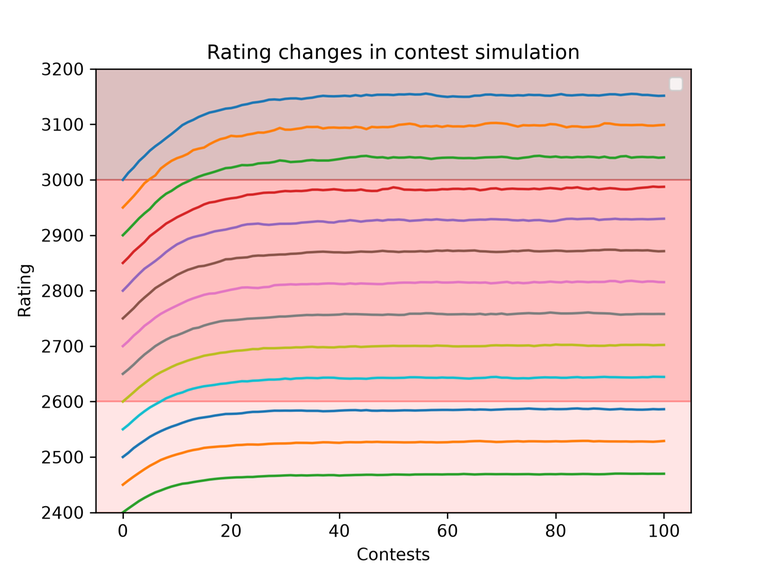
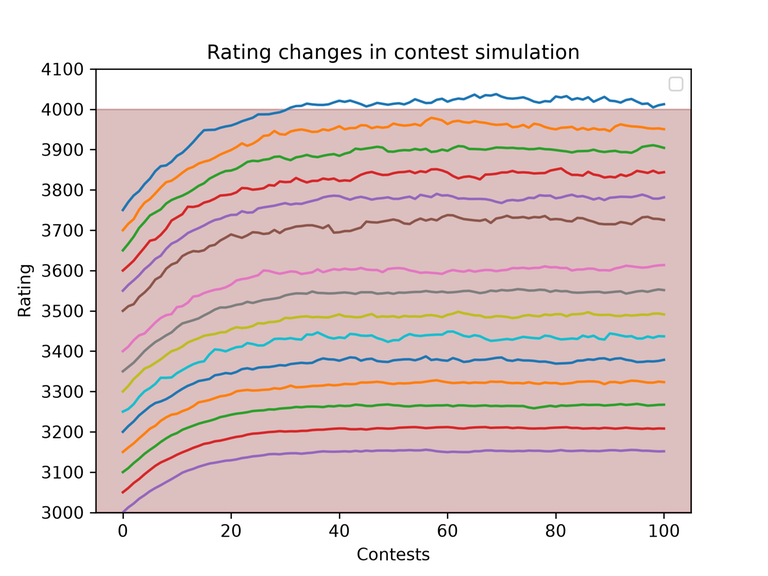
Here are the graphs:
- 1900-2400
- 2400-3000
- 3000+
- Everything
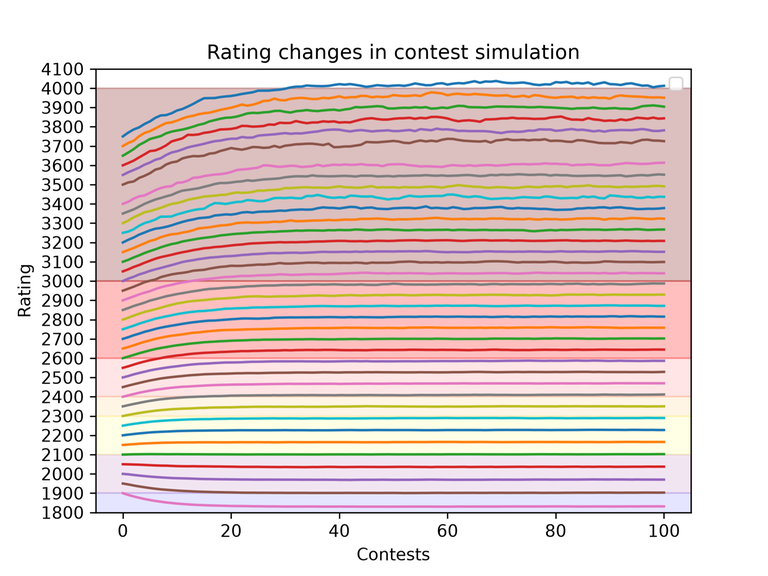
So, it seems like this is true! There is some fairly dramatic inflation at the top. And it only takes maybe 40 contests for it to fully converge. And surprisingly, it starts as early as deep red level: if your true skill is 2600, your actual rating will probably be around 2702. For LGMs, the inflation can be as high as 150-200 points.
Is this a big problem?
Not really. It just means that the scale is a bit more stretched out than it should, especially near the top. The ratings still maintain the ability to compare.
I would assume it would also be possible to fix with some math by switching the update formula to something based on likelihood estimation. We can't simply use performance is that the performance of 1st place is infinitely large. We could do numerical max a posteriori estimation — with some rating deviation (either explicitly stored or implicitly set to, say, 100, for everyone), and we numerically update the distribution (as in, we store the distribution as a table of probability densities at, say, 0.1 rating increments) and calculate the new center (whether that be expectation, median, mode, or whatever). Also I guess calculating likelihood (which is $$$P(\text{get place 67} | \text{rating 2900})$$$) is not trivial, since you have some weird sum of Bernoulli variables.
That's it for today! As always, thanks for reading, and you can find the code and figures on my GitHub.


Bro did a deep analysis just for fun
All for contribution T-T
Didn’t have to expose me like that man
You admited it dude
if the top 1% of users hold 50% of CF's weighted rating...
This can only end with the RISE of the PROLETARIAT
On second thought the GMs have really high crit damage so
What an absolutely legendary reference... maybe if Techno had done Codeforces, he would have had a pink handle somehow
Well 5000 is currently taken by Puddles_Penguin but maybe we could have a pig rank at 6000
W reference
don't ask me why there are police outside your house.
House? I'm homeless
DuyMinh3005 please donate to my bitcoin wallet here so i can eat this month
The ad saved me :)
greateric lesson learnt: never click on greateric's link
This is not a CF blog this is an entire short research paper XD
I got to say the rating inflation at the bottom is caused by AI usage on the bottom, since at this time, most people can't pay for the smart AI models to cheat their way up, also it's way easier to catch TOP Cheaters and ban them. There is significant rating deflation at the bottom, by around 200pts at least, therefore the people at the top are being boosted. While the people at the bottom keep dragging each other down lol.
The simulation runs as if the internal rating is ground truth. As in, Benq will play like an idealized 3750 that satisfies all the modeling assumptions of Elo points (400 points = 10x win ratio) and a 1400 will play like an idealized 1400 (not a cheater).
This simulation only attempts to test if there are mathematical weaknesses in the CF rating system. If we have cheaters (some 1400s play like 3000s), I would expect them to siphon rating from all high rated players.
Waiting for the next useless blog...
bro didnt get the memo that im not at home rn :sob:
How can I click on the link AGAIN??
Different song :)
That's how you tricked my Rickroll Detection extension...
Are you home now...
yes
i've wanted to ask this for a while, especially bcz of A2OJ ladders, how do the ratings of old problems map to ratings of current problems, "adjusted for inflation"?
This one is fairly harder to do. What you could do is try to get a random-ish sample of volunteers to try to solve old and new problems, and compare the solve rates to get a "rating adjustment"
e.g. if old problems of a specific rating are soled by 91% and new problems of the same rating are solved by 50%, they are effectively 400 points harder.
@greateric why all submissions of your initial contests have AI comments and very obvious AI variable names?
Yep someone clueless tries to expose greateric again.
I thought we went over this. I made some bad choices back then. You can read the full thing at http://apology.greatericontop.me/
dang, I accidentally clicked on it again...
"accidentally" Saying ANYTHING to not look like you fell for a rickroll :cry:
Last time, I clicked on this and regretted it. Now I clicked on it again while being confident that an ad would save me...until I realized that my adblocker is on
i knew it
Youtube's ads just ruined your Rick Roll :(
Because greateric is secretly an LLM training to destroy the world by doing programming war crimes and convincing others that the government (the nutellas and hqs) is faulty