Блог пользователя OmarAboutaleb77

Автор OmarAboutaleb77, история, 3 месяца назад, По-английски

As pretty much everyone knows at this point, cheating on codeforces is becoming more and more rampant. I have 3 suggestions that will help both prevent and catch cheating.

Allow users to report cheaters

This is pretty self explanatory. I don't think there exists a report method, and it seems like the only way to bring attention to someone cheating is to make a blog post or comment which definitely isn't efficient.

Change cheaters handle color

Even if a cheater has been caught, they generally face minimal repercussions. It doesn't make sense to go through their account looking skipped submissions. Instead, changing their handle to a color that will stand out will deter them from cheating. If they are cheating to brag about their rating, all that will go away when their handle changes color.

IP Bans / Sign up with phone number etc

Also pretty self explanatory. The only problem I can see with this is that users that live in countries with restricted internet will have more limited access to codeforces.

Полный текст и комментарии »

  • Проголосовать: нравится
  • +63
  • Проголосовать: не нравится

Автор OmarAboutaleb77, история, 3 месяца назад, По-английски

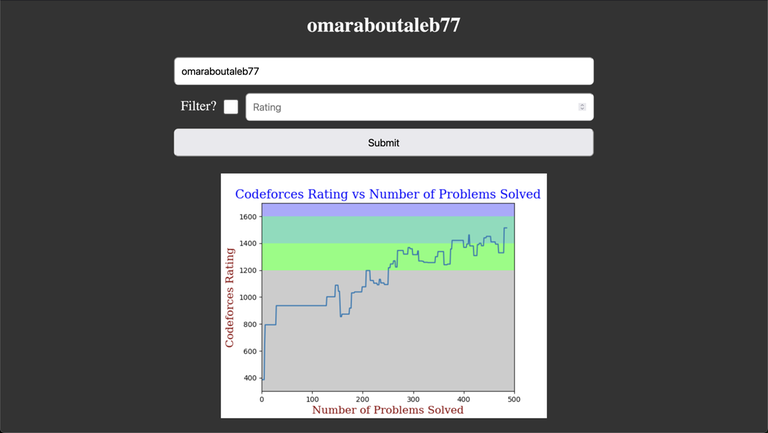
Hi everyone, I made a website using the Codeforces API that can graph your Rating vs Count of Problems Solved. I can also filter to see how you're improving if you only count problems of a specific rating or higher.

The URL is https://codeforcesplot-app-5def7a85c434.herokuapp.com.

This is the application UI:

By default, the website displays all problems, but you can filter the problems to only display problems above a specific rating.

You also no longer need a CLIST account to be able to plot your data. All codeforces accounts work.

Полный текст и комментарии »

  • Проголосовать: нравится
  • +50
  • Проголосовать: не нравится

Автор OmarAboutaleb77, история, 3 месяца назад, По-английски

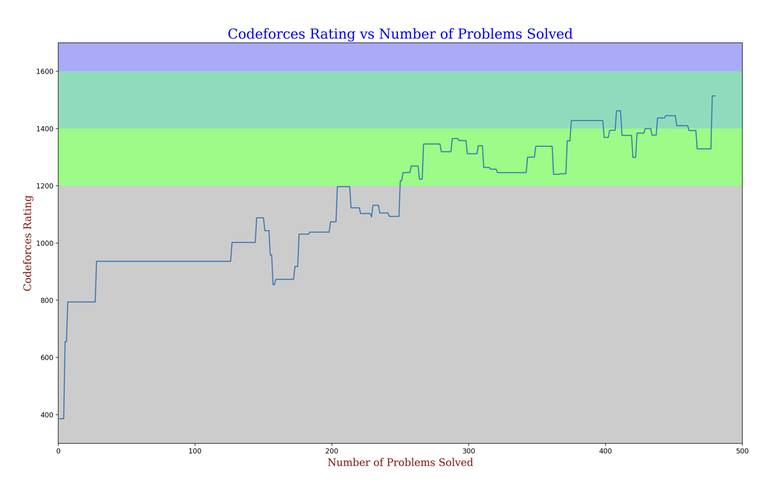
Hi everyone. I was curious what my rating graph would look like if I plotted it with problems solved on the X Axis instead of time. I have big gaps in my practice, and I barely do any codeforces for the majority of the year (only the occasional contest for fun).

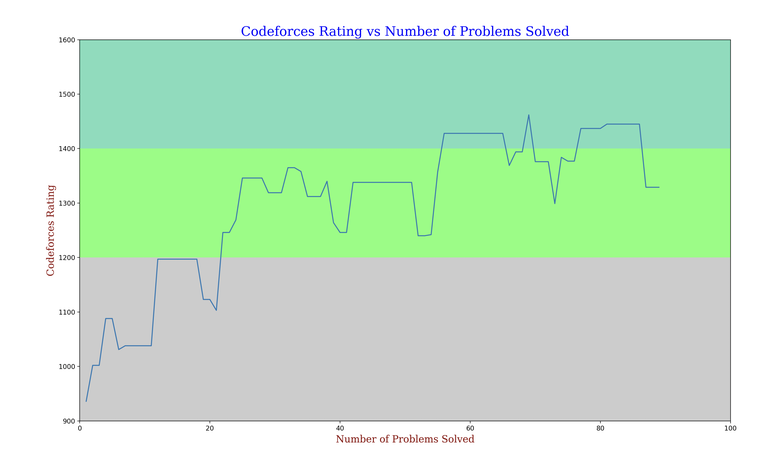
I wrote a python script using the CLIST and Codeforces API which can graph your Rating vs Count of Problems Solved. I can also filter to see how you're improving if you only count problems of a specific rating.

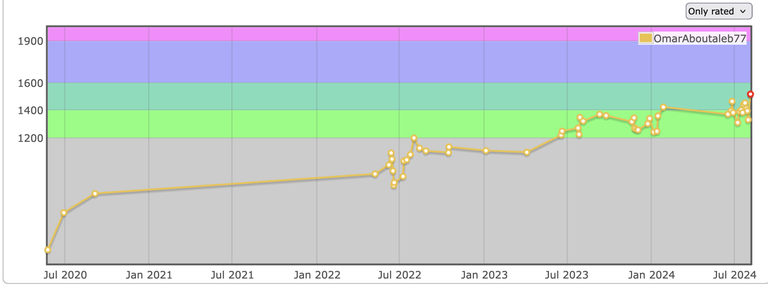
This is my normal graph: My normal graph

This is my Rating vs Count of Problems Solved Graph: Rating vs Count of Problems Solved Graph

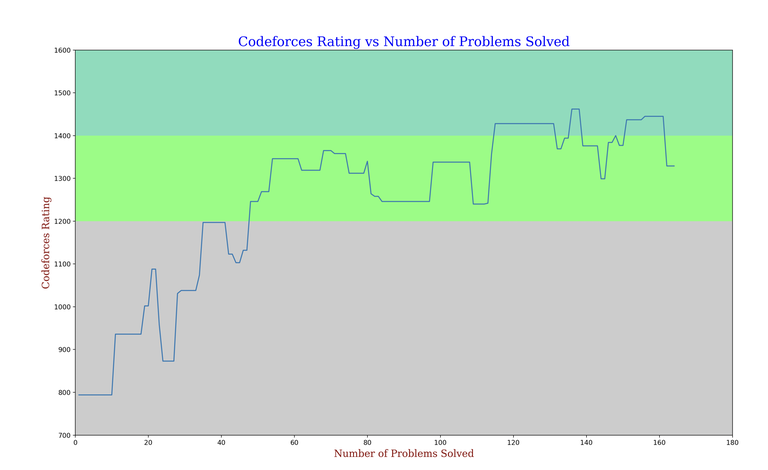
This is my Rating vs Count of Problems Solved Graph if we only count problems with a rating >= 1200*:

This is my Rating vs Count of Problems Solved Graph if we only count problems with a rating >= 1400*:

If anyone is interested I can plot your rating graph as long as you have a clist account with your codeforces account attached to it.

* Contests which have problems that don't have a rating yet aren't included.

Полный текст и комментарии »

  • Проголосовать: нравится
  • +50
  • Проголосовать: не нравится