


Hello, Codeforces!
Sometimes the same code gets TLE, and then AC on a rejudge or a resubmit. Or it passes pretests and then gets TLE on system tests, which hurts even more. People asked about this here more than once (2018, 2021, 2022), and I also saw it happen when I was judging a contest.
This happens because the measured time depends on what else the machine is doing, like how many other programs are running next to yours and what frequency the CPU decides to run at. The Polish OI avoids this by counting CPU instructions instead of measuring time (there is a paper about it by Paweł Dietrich and Bartosz Kostka). I wanted real numbers on Codeforces code, so I ran 295 accepted submissions 10 times each, with up to 32 jobs running at once, and compared CPU time with instruction counts.
TL;DR: with 16 jobs at once on my 8 core laptop, CPU time gave 27.5% of the submissions different verdicts between runs (21.0% even with the laptop tuned for timing). Instruction counts never changed a verdict. But they don't see memory stalls, so they are harder on tight loops and easier on memory heavy code.
What I did
I took 295 accepted C++ submissions to 106 problems from open-r1's Codeforces dataset. Most of them used more than half of the TL on Codeforces. I ran each one 10 times on its heaviest test, with 1, 8, 16 or 32 jobs running at once on my laptop (Ryzen 7 4800H, 8 cores / 16 threads). Then I did everything again with the laptop tuned for stable timing, which means boost off and most of the other settings isolate recommends.
But how do you set a TL for instructions, you might ask? I gave each measure its own limit, the way a setter picks a TL: 2x the slowest AC of the problem, measured on my laptop. For instructions it's 2x the highest instruction count among the ACs of the problem. This way every submission passes when it runs alone, and any TLE after that comes from the load. If the 10 runs of a submission don't all get the same verdict, I call it a flip.
Results
Here is the share of submissions that flipped:
| Judged by | 1 job | 8 jobs, 1 per core | 16 jobs | 32 jobs |
|---|---|---|---|---|
| CPU time, default | 0% | 4.1% | 27.5% | 16.3% |
| CPU time, tuned | 0% | 1.4% | 21.0% | 10.5% |
| Instructions | 0% | 0% | 0% | 0% |
The 32 jobs column has fewer flips only because the submissions near the TL tend to get TLE in all 10 runs there, so they stop counting as flips.
The instruction count of a submission never went more than 0.04% above its solo count, at any load. CPU time is a different story: at 16 jobs, the slowest run of the median submission took 2.2x its solo time.
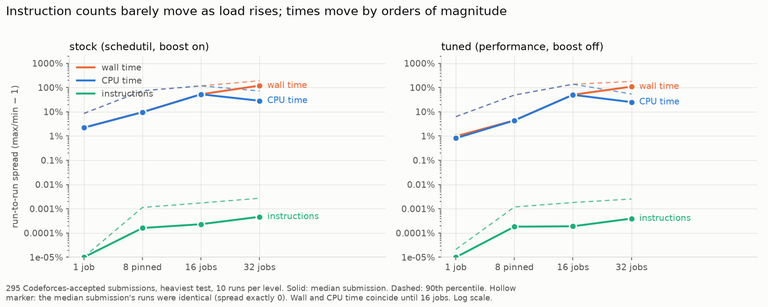
This is how much the 10 runs of a submission differ from each other, on a log scale ("stock" in the plot is the default settings).
So a careful judge can keep CPU time pretty stable: 8 jobs, one per core, tuned, and only 1.4% flipped. But judging by instructions with 16 jobs on default settings got through the tests 1.4x faster than that, and nothing flipped.
So is counting instructions just better?
Not completely, because an instruction count doesn't see the time a program spends waiting on memory. For example, a tight loop can do more than 15 billion instructions per second, while a program that keeps missing the cache does less than 2 billion. So compared to a time limit, an instruction limit is harder on tight loops and easier on memory heavy code.
To see how much this matters, I checked it against the times on Codeforces. I took the 111 pairs of ACs to the same problem where one was at least 2x slower than the other on Codeforces. Instructions put 20 of these pairs in the wrong order (18.0%), while my local CPU time got 6 wrong (5.4%).
If you set problems or run a judge
For judging by CPU time, what kept verdicts almost stable here was one job per physical core, boost off, and a TL of at least 2x the slowest AC.
For judging by instructions, you can use the whole machine. But leave some headroom (I used 2x), since tight loops pay more, and still keep a loose time limit for programs that sleep or block. Also, set the limits on the same CPU model you judge on, because instruction counts differ between CPU models (I only tested one).
Keep in mind that I only used AC submissions, so this only shows false TLEs. It can't tell if instruction limits still catch code that is actually too slow.
Code
The sandbox is tallyrun, which I wrote in Rust. It counts instructions with perf_event_open and prints one line of JSON with the instructions, CPU time, wall time and memory. There is also a small Python mini judge that shows how to get verdicts from it. The benchmark code, the raw results and all the tables are in tallyrun-bench.
I'd like to hear from people who set problems or run judges. Would you trade a bit of fairness between tight loops and memory heavy code for verdicts that never depend on load? And if you used sio2jail or something similar on a real judge, what problems did you face?
If you find a mistakes, please tell me in the comments and I'll fix them.


