


Hey guys it's your favorite purple not anymore CF shitposter here. We're back to hopefully non-controversial useless information lol
I think anecdotally we all have this gut feeling that it's harder to get a X perf in a div 2 than a div 3, and in turn harder to get X perf in a div 1 than a div 2. Is this urban legend or a real phenomenon?
Methodology
I took several of the most recent separated div 1 and div 2 rounds where the div 1 round has the same problems shifted by 2 positions.
For each contestant in the div 2 round, we'll:
- Calculate and record their div 2 perf
- Convert to estimated div 1 score by dropping problem A/B, adjusting timestamps on the rest of the problems, and recalculating the score based on the problem values for div 1. (We will discard anyone who solves C/D/E/F before A/B)
- Calculate and record their div 1 perf from the new score we calculate.
Calculating performance (CP lesson time!)
Using FFT, our favorite :yayy:
Let's formally define performance as, position $$$p$$$ having performance $$$x$$$ means that if your rating was $$$x$$$, then the expected value of your placing is $$$p$$$.
If we make places 0-based (winning would be 0th place), we can use linearity of expectation:
where $$$E[\text{tourist}]$$$ is the chance of you losing to tourist, which is given by
where $$$y$$$ is the rating of the other participant and $$$x$$$ is the performance.
This is how Codeforces (and we) will calculate the performance.
Now the fun part is that we can speed this up using FFT. Instead of having an quadratic-type algorithm where you have to spend $$$O(n)$$$ time summing up all those expectations for every performance you want to calculate, let's convolve them.
Define a one-hot encoding array $$$a$$$ such that $$$a_i$$$ is the number of people in the field with rating $$$i$$$. For example, if there are 2 people with rating 3 and 1 person with rating 4, we might have $$$a = [0, 0, 2, 1, 0]$$$.
Then, the place of a performance $$$x$$$, which I will call $$$f(x)$$$, is:
Do you see the convolution/cross-correlation yet? We essentially want to convolve an array $$$b$$$ that contains all the lose-chances in a sliding window along the array $$$a$$$. That would calculate all the performances of all the ratings in a range $$$[l, r]$$$ in time $$$(r-l) \log (r-l)$$$.
Here's an illustration to try to show this more concretely. Let's assume that in this fictional rating system, you trade games when your rating is equal, have a 70% chance to win if your rating is 1 point higher, and are guaranteed to win if your rating is 2 or more points higher. In other words, $$$b$$$ would look like $$$[..., 0, 0, 0.3, 0.5, 0.7, 1, 1, ...]$$$
Then suppose our one-hot is $$$a = [1, 0, 0, 1, 2]$$$: 1 person with rating 1, 1 person with rating 4, 2 people with rating 5. We would calculate:
rating       1    2    3    4    5
    a        1    0    0    1    2
       0.3  0.5  0.7   1    1    1    1     # suppose our rating is 1

# Expected placing: 1*0.5 + 0*0.7 + 0*1 + 1*1 + 2*1 = 3.5
# So placing 3.5 would be a performance of 1 rating.

rating       1    2    3    4    5
    a        1    0    0    1    2
            0.3  0.5  0.7   1    1    1     # suppose our rating is 2 now

# Expected placing: 1*0.3 + 0*0.5 + 0*0.7 + 1*1 + 2*1 = 3.3
# So placing 3.3 would be a performance of 2 rating.

# And so on, moving the window
Once we have that, we take the time spent to solve div 2 C/D/E/... and map that to div 1 A/B/C. This allows us to calculate the score and performance in the div 1 round.
Results
I analyzed all 15 div 1/2 separated rounds over roughly the last year. The results are... weird.
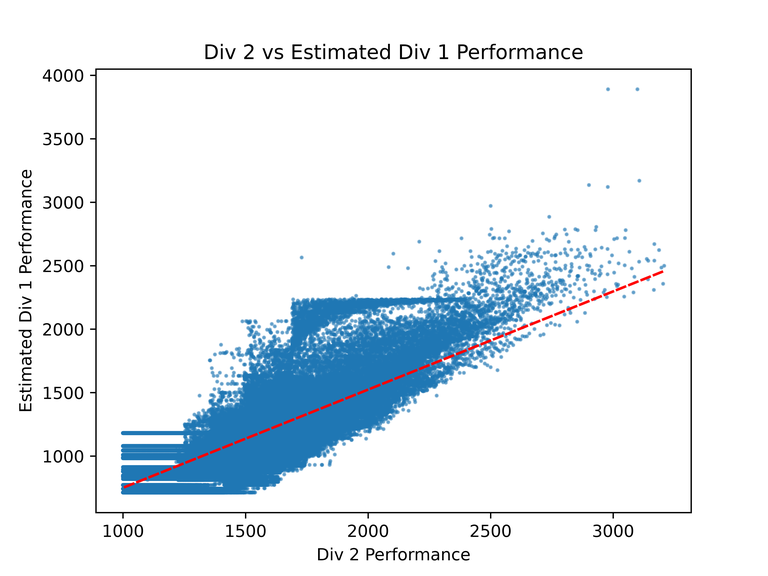
This is the graph of div 2 vs div 1 performance over them all.
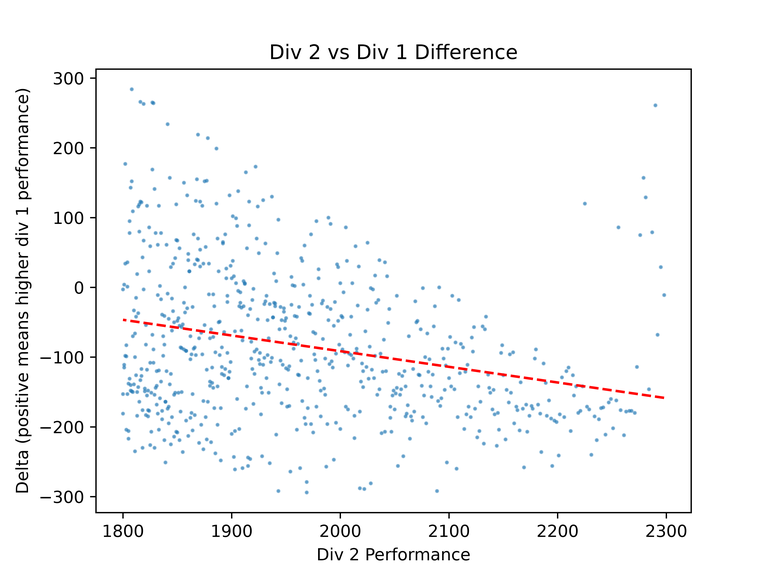
For the most recent round 1105, for most people in the 1800 to 2300 range, div 1 was roughly 50 to 120 rating points harder.
However, over all rounds, div 1 was approximately 400 points harder than div 2. There was a lot of variance between rounds; some had div 1s up to 600 points harder, and others had div 1s that were actually a few points easier. This doesn't really make a lot of sense; intuitively we all know that can't be true.
Some explanations for the somewhat crazy results could include:
- You do lose the time you spent on div 2 A/B into a black hole forever. Even if we adjust the penalty, you may lose the ability to solve an additional problem if you just needed another like 5 or 10 minutes of time.
- You are "fresher" in div 1, since you don't have to spend any mental energy on div 2 A/B.
- There could be some bias in the data. Maybe a lot of people who "place well but not too well" in div 2 were boosted by really fast/accurate solves on div 2 A/B that go away when we remove them in div 1. For example for most people in the 1600-2000 perf range their div 1 data is really only the time it took them to solve problem C after B, or to solve problems C and D. It is also possible that div 1 rewards solves on harder problems more than speed on early problems.
- Maybe my method is just bugged?
- Or div 1 could really be deflated by that much in comparison to div 2.
If you were hoping for a number with a nice-looking confidence interval attached, sorry! Unfortunately this data is not nice to work with. You can find the rest of the high-res graphs for each contest at https://github.com/greatericontop/Codeforces-Div1vsDiv2/tree/main/assets/per_contest. You can also get the source code there and run some tests yourself and/or potentially find a bug in my approach that might be causing the results lol
Why do ratings desync?
Ratings can only compare skill across a population if the entire population interacts. Otherwise, such as in the case of div 1 and div 2, you may end up with "div 1 flavored rating" and "div 2 flavored rating" that cannot be compared to each other.
The solution is to make sure the populations mix as much as possible. I think CF does a pretty decent job at this. We have combined 1+2 rounds every so often that mix everyone together, and div 3/4 participants can also participate in div 2 which does some mixing there.
A quick note on problem ratings
You may also have a gut feeling that a 2100-rated div 3/4 problem is easier than a 2100-rated div 1/2 problem.
I think this is true given what we know about div 1 vs div 2 flavored ratings. What also could be a factor is positioning — a div 3 F may be the same difficulty as a div 2 D, but div 3 contestants had less time during the contest to solve it on average. That can artificially drive up the rating of the div 3 problem.


