


| — You know what they call an International Grandmaster in 2026? — They don't call it an International Grandmaster? — No, man, they got the AI there, they wouldn't know what International Grandmaster is. — What'd they call it? — They call it International Master. |
Introduction
There was a heated discussion recently, and I decided to quantify the rating deflation over the recent 1.5 years.
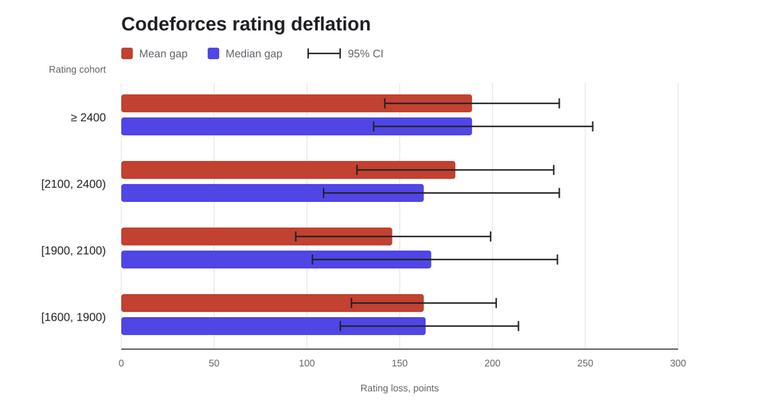
After accounting for natural improvement, I found roughly 150-190 rating points of deflation. The following is the rating gap between AI period and pre-AI period.
Background
- We need to estimate the recent rating dynamics and compare it with pre-AI dynamics.
- Participants have natural improvement when they train, especially lower rated participants. We need to account for that.
- We need to somehow restrict the data to likely legitimate users.
Methods
I estimated rating dynamics in two periods:
- January 2025 — June 2026. I call it the AI period.
- January 2023 — June 2024. I call it the pre-AI period.
For each period I formed 4 cohorts, based on the contestant rating at the start of the period:
- rating $$$\ge 2400$$$
- rating $$$[2100, 2400)$$$
- rating $$$[1900, 2100)$$$
- rating $$$[1600, 1900)$$$
I used several simple filtering criteria to increase the probability of legitimacy of sampled contestants. For example, I excluded several regions from sampling.
For each cohort I used all users left after filtering.
For each user, I computed delta as rating at the end of the period minus rating at the start of the period. For each cohort, I computed mean delta and median delta. The gap is AI period delta minus pre-AI period delta. The mean-gap CI is a Welch two-sample 95% confidence interval. The median-gap CI is a 95% bootstrap interval.
Results
The main tables compare raw rating change in the AI period with raw rating change in the pre-AI period.
| Cohort by starting rating | AI period cohort size | Pre-AI period cohort size | AI period mean delta | Pre-AI period mean delta | Mean gap | Welch 95% CI |
|---|---|---|---|---|---|---|
| $$$\ge$$$ 2400 | 94 | 97 | -164 | +25 | -189 | [-236, -142] |
| $$$[2100, 2400)$$$ | 117 | 113 | -96 | +84 | -180 | [-233, -127] |
| $$$[1900, 2100)$$$ | 126 | 94 | -33 | +113 | -146 | [-199, -94] |
| $$$[1600, 1900)$$$ | 258 | 203 | +37 | +200 | -163 | [-202, -124] |
| Cohort by starting rating | AI period cohort size | Pre-AI period cohort size | AI period median delta | Pre-AI period median delta | Median gap | Bootstrap 95% CI |
|---|---|---|---|---|---|---|
| $$$\ge$$$ 2400 | 94 | 97 | -172 | +17 | -189 | [-254, -136] |
| $$$[2100, 2400)$$$ | 117 | 113 | -82 | +81 | -163 | [-236, -109] |
| $$$[1900, 2100)$$$ | 126 | 94 | -40 | +127 | -167 | [-235, -103] |
| $$$[1600, 1900)$$$ | 258 | 203 | +18 | +182 | -164 | [-214, -118] |
So the pre-AI period had clear natural improvement in the lower three cohorts. In the AI period this improvement disappeared, and the high-rated cohorts lost rating on average.
AI period, January 2025 — June 2026:
| Handle | Country | Jan 2025 rating | Jun 2026 rating | Delta | Rated contests |
|---|---|---|---|---|---|
| Rubikun | Japan | 2919 | 2542 | -377 | 38 |
| defnotmee | Brazil | 2403 | 2283 | -120 | 21 |
| fastmath | Russia | 2469 | 2348 | -121 | 16 |
| physics0523 | Japan | 2598 | 2266 | -332 | 34 |
| ace5 | Russia | 2548 | 2370 | -178 | 23 |
| sansen | Japan | 2553 | 2149 | -404 | 29 |
| LuCpp | Germany | 2775 | 2723 | -52 | 16 |
| k1r1t0 | Belarus | 2513 | 2340 | -173 | 33 |
| gloria_mundi | Germany | 2757 | 2716 | -41 | 18 |
| DylanSmith | United States | 2476 | 2209 | -267 | 13 |
| katyaporay | Russia | 2598 | 2583 | -15 | 24 |
| Golovanov399 | Russia | 2906 | 2799 | -107 | 27 |
| leinad2 | South Korea | 2558 | 2757 | +199 | 28 |
| noimi | Japan | 3103 | 2884 | -219 | 20 |
| iakovlev.zakhar | Russia | 2508 | 2216 | -292 | 24 |
| mwen | United States | 2419 | 2088 | -331 | 22 |
| anmichi | Japan | 2607 | 2542 | -65 | 28 |
| hos.lyric | Japan | 3256 | 3174 | -82 | 31 |
| libobil | Bulgaria | 2421 | 2086 | -335 | 18 |
| VladProg | Ukraine | 2642 | 2394 | -248 | 16 |
| literalchild | Singapore | 2558 | 2862 | +304 | 31 |
| PvPro | Russia | 2614 | 2794 | +180 | 20 |
| potato167 | Japan | 3337 | 2996 | -341 | 36 |
| SorahISA | Taiwan | 2474 | 2233 | -241 | 14 |
| Hamed_Ghaffari | Iran | 2599 | 2719 | +120 | 31 |
| Kude | Japan | 2523 | 2304 | -219 | 38 |
| Andreasyan | Armenia | 2616 | 2552 | -64 | 20 |
| Egor | Germany | 3126 | 2824 | -302 | 25 |
| Forested | Japan | 2849 | 2613 | -236 | 16 |
| olmrgcsi | Taiwan | 2502 | 2283 | -219 | 25 |
| tute7627 | Japan | 2947 | 2628 | -319 | 34 |
| noya2 | Japan | 2484 | 2265 | -219 | 33 |
| Ormlis | Russia | 3381 | 3138 | -243 | 23 |
| imirdy | Germany | 2592 | 2468 | -124 | 17 |
| tourist | Belarus | 3840 | 3486 | -354 | 33 |
| kotatsugame | Japan | 2907 | 2757 | -150 | 36 |
| jason_sun | United States | 2687 | 2578 | -109 | 13 |
| tch1cherin | Russia | 2405 | 2042 | -363 | 27 |
| Tlatoani | Mexico | 2750 | 2790 | +40 | 22 |
| Petr | Switzerland | 3207 | 3051 | -156 | 16 |
| MAKMED1337 | Ukraine | 2449 | 2057 | -392 | 27 |
| sevlll777 | Niue | 2598 | 2390 | -208 | 26 |
| antontrygubO_o | Ukraine | 3086 | 3017 | -69 | 23 |
| pooty | Singapore | 2537 | 2252 | -285 | 26 |
| Sofapuden | Denmark | 2564 | 2058 | -506 | 24 |
| risujiroh | Japan | 2674 | 2497 | -177 | 37 |
| toam | Japan | 2509 | 2527 | +18 | 30 |
| Hyperbolic | South Korea | 2504 | 2446 | -58 | 30 |
| ksun48 | Canada | 3691 | 3335 | -356 | 36 |
| ahsoltan | Poland | 2418 | 2289 | -129 | 25 |
| abc864197532 | Taiwan | 2671 | 2791 | +120 | 18 |
| leaf1415 | Japan | 2464 | 2352 | -112 | 27 |
| Xellos | Slovakia | 2540 | 2284 | -256 | 38 |
| 244mhq | Belarus | 2943 | 2869 | -74 | 25 |
| Noam527 | Israel | 2932 | 2740 | -192 | 17 |
| Nyaan | Japan | 2649 | 2632 | -17 | 35 |
| A_G | United States | 3147 | 2696 | -451 | 15 |
| YuukiS | United States | 2491 | 2648 | +157 | 25 |
| Nachia | Japan | 3264 | 3304 | +40 | 28 |
| alireza_kaviani | Iran | 2916 | 2481 | -435 | 24 |
| ecnerwala | United States | 3525 | 3146 | -379 | 30 |
| golomb | United States | 2458 | 2491 | +33 | 27 |
| mtsd | Japan | 2717 | 2562 | -155 | 31 |
| Rafi22 | Poland | 2622 | 2590 | -32 | 21 |
| Pyqe | Indonesia | 2899 | 2743 | -156 | 14 |
| cn449 | Japan | 2726 | 2621 | -105 | 39 |
| Noobish_Monk | Germany | 2508 | 2177 | -331 | 25 |
| p0tato | Hong Kong | 2402 | 2574 | +172 | 18 |
| QwertyPi | Hong Kong | 2797 | 2710 | -87 | 25 |
| StelIawinD | Greenland | 2514 | 2484 | -30 | 23 |
| maspy | Japan | 3300 | 3158 | -142 | 35 |
| kmjp | Japan | 2503 | 2321 | -182 | 36 |
| TKT_YI | Japan | 2684 | 2556 | -128 | 37 |
| middle_man | South Korea | 2595 | 2424 | -171 | 28 |
| hitonanode | Japan | 2987 | 2706 | -281 | 18 |
| ko_osaga | South Korea | 2976 | 2721 | -255 | 17 |
| AgafonovArtem | Russia | 2473 | 2321 | -152 | 15 |
| natsugiri | Japan | 2518 | 2167 | -351 | 31 |
| dorijanlendvaj | Croatia | 3236 | 2977 | -259 | 17 |
| siganai | Japan | 2681 | 2440 | -241 | 27 |
| Arterm | Belarus | 2436 | 2165 | -271 | 20 |
| turkhuu622 | Mongolia | 2476 | 2383 | -93 | 21 |
| maroonrk | Japan | 3379 | 3521 | +142 | 27 |
| AntiBsayer | Jordan | 2543 | 2306 | -237 | 28 |
| shiomusubi496 | Japan | 2893 | 2798 | -95 | 16 |
| chinerist | Japan | 2724 | 2503 | -221 | 24 |
| zhenja | Russia | 2412 | 2398 | -14 | 22 |
| LeoPro | Russia | 2786 | 2393 | -393 | 17 |
| BurnedChicken | Taiwan | 3206 | 2971 | -235 | 28 |
| keisuke6 | Japan | 2544 | 2619 | +75 | 26 |
| Endagorion | Cyprus | 3022 | 2598 | -424 | 15 |
| Marckess | Mexico | 2430 | 2349 | -81 | 26 |
| maxplus | Russia | 2572 | 2582 | +10 | 14 |
| dreamoon_love_AA | Taiwan | 2772 | 2352 | -420 | 19 |
Pre-AI period, January 2023 — June 2024:
| Handle | Country | Jan 2023 rating | Jun 2024 rating | Delta | Rated contests |
|---|---|---|---|---|---|
| toam | Japan | 2466 | 2512 | +46 | 32 |
| A_G | United States | 2816 | 2901 | +85 | 29 |
| ksun48 | Canada | 3326 | 3378 | +52 | 32 |
| ainta | South Korea | 3017 | 2820 | -197 | 27 |
| Noam527 | Israel | 2660 | 2722 | +62 | 19 |
| awoo | Russia | 2435 | 2310 | -125 | 24 |
| sstrong | Kazakhstan | 2445 | 2518 | +73 | 40 |
| hitonanode | Japan | 3182 | 2957 | -225 | 29 |
| AmShZ | Iran | 2453 | 2441 | -12 | 15 |
| abc864197532 | Taiwan | 2706 | 2744 | +38 | 19 |
| dreamoon_love_AA | Taiwan | 2663 | 2708 | +45 | 24 |
| Radewoosh | Poland | 3602 | 3373 | -229 | 26 |
| olmrgcsi | Taiwan | 2403 | 2329 | -74 | 29 |
| sansen | Japan | 2683 | 2822 | +139 | 28 |
| S2speed | Iran | 2672 | 2680 | +8 | 33 |
| mango. | Canada | 2408 | 2422 | +14 | 24 |
| afterall | Iran | 2412 | 2316 | -96 | 21 |
| antontrygubO_o | Ukraine | 3017 | 2772 | -245 | 31 |
| budalnik | Russia | 2876 | 2555 | -321 | 12 |
| -is-this-fft- | Estonia | 2444 | 2475 | +31 | 27 |
| maspy | Japan | 2878 | 3198 | +320 | 36 |
| leaf1415 | Japan | 2408 | 2602 | +194 | 39 |
| hos.lyric | Japan | 3142 | 3234 | +92 | 34 |
| Mangooste | Russia | 2615 | 2769 | +154 | 15 |
| alireza_kaviani | Iran | 2802 | 2701 | -101 | 23 |
| tfg | Brazil | 2481 | 2528 | +47 | 28 |
| SPD_9X2 | Japan | 2434 | 2189 | -245 | 23 |
| VladProg | Ukraine | 2500 | 2687 | +187 | 17 |
| nuip | Japan | 2479 | 2626 | +147 | 21 |
| Alon-Tanay | Israel | 2481 | 2582 | +101 | 15 |
| JeanBombeur | Vatican | 2418 | 2435 | +17 | 25 |
| Xellos | Slovakia | 2520 | 2377 | -143 | 39 |
| BalintR | Canada | 2523 | 2897 | +374 | 20 |
| Swistakk | Poland | 3015 | 2991 | -24 | 15 |
| MateoCV | Argentina | 2424 | 2391 | -33 | 29 |
| tute7627 | Japan | 2871 | 3016 | +145 | 38 |
| TadijaSebez | Serbia | 2761 | 2633 | -128 | 16 |
| jeroenodb | Netherlands | 2613 | 2754 | +141 | 26 |
| 244mhq | Belarus | 3008 | 3110 | +102 | 35 |
| orz | Russia | 2639 | 2757 | +118 | 16 |
| kotatsugame | Japan | 2905 | 2920 | +15 | 41 |
| noimi | Japan | 3353 | 3173 | -180 | 35 |
| Brovko | Russia | 2689 | 2701 | +12 | 25 |
| jdurie | United States | 2662 | 2528 | -134 | 22 |
| Hyperbolic | South Korea | 2512 | 2493 | -19 | 31 |
| Andreasyan | Armenia | 2479 | 2491 | +12 | 29 |
| Ormlis | Russia | 3134 | 3159 | +25 | 35 |
| dlalswp25 | South Korea | 2814 | 2856 | +42 | 28 |
| Maksim1744 | Russia | 3124 | 2976 | -148 | 21 |
| Ra16bit | Belarus | 2498 | 2477 | -21 | 22 |
| emthrm | Japan | 2607 | 2418 | -189 | 35 |
| Kapt | Russia | 2791 | 3062 | +271 | 28 |
| rniya | Japan | 2466 | 2624 | +158 | 36 |
| Pyqe | Indonesia | 2717 | 2834 | +117 | 18 |
| physics0523 | Japan | 2497 | 2580 | +83 | 42 |
| Forested | Japan | 2563 | 2920 | +357 | 26 |
| icecuber | Norway | 2661 | 2570 | -91 | 25 |
| Endagorion | Cyprus | 3010 | 2823 | -187 | 22 |
| SecondThread | United States | 2488 | 2352 | -136 | 18 |
| Kude | Japan | 2559 | 2522 | -37 | 40 |
| Um_nik | United Kingdom | 3541 | 3353 | -188 | 29 |
| feeder1 | Singapore | 2462 | 2540 | +78 | 36 |
| peltorator | Switzerland | 2547 | 2755 | +208 | 20 |
| Egor | Germany | 2943 | 2870 | -73 | 16 |
| shiomusubi496 | Japan | 2473 | 2774 | +301 | 21 |
| tourist | Belarus | 3803 | 3845 | +42 | 31 |
| TeaPot | Russia | 2570 | 2475 | -95 | 15 |
| pavlekn | Russia | 2440 | 2268 | -172 | 21 |
| maroonrk | Japan | 3504 | 3372 | -132 | 41 |
| Xylenox | United States | 2576 | 2817 | +241 | 33 |
| mtsd | Japan | 2535 | 2514 | -21 | 29 |
| arnold518 | South Korea | 2461 | 2430 | -31 | 22 |
| Amoo_Safar | Iran | 2837 | 2797 | -40 | 20 |
| Marckess | Mexico | 2428 | 2495 | +67 | 28 |
| hank55663 | Taiwan | 2967 | 2773 | -194 | 35 |
| Geothermal | United States | 2928 | 3569 | +641 | 22 |
| Rubikun | Japan | 2922 | 2824 | -98 | 42 |
| Akulyat | France | 2453 | 2377 | -76 | 32 |
| iakovlev.zakhar | Russia | 2530 | 2556 | +26 | 17 |
| potato167 | Japan | 2894 | 3138 | +244 | 36 |
| natsugiri | Japan | 2605 | 2619 | +14 | 34 |
| ecnerwala | United States | 3354 | 3501 | +147 | 28 |
| chinerist | Japan | 2639 | 2572 | -67 | 34 |
| tatyam | Japan | 2818 | 2961 | +143 | 20 |
| QwertyPi | Hong Kong | 2437 | 2789 | +352 | 32 |
| Dart-Xeyter | Russia | 2453 | 2381 | -72 | 19 |
| Adam_GS | Poland | 2503 | 2720 | +217 | 21 |
| tabr | Japan | 2725 | 2680 | -45 | 17 |
| Nyaan | Japan | 2735 | 2767 | +32 | 28 |
| Petr | Switzerland | 3315 | 3322 | +7 | 19 |
| Tlatoani | Mexico | 2652 | 2768 | +116 | 38 |
| risujiroh | Japan | 2622 | 2747 | +125 | 40 |
| dorijanlendvaj | Croatia | 3024 | 2999 | -25 | 14 |
| LeoPro | Russia | 2571 | 2849 | +278 | 20 |
| Golovanov399 | Russia | 3004 | 3194 | +190 | 33 |
| kmjp | Japan | 2793 | 2503 | -290 | 36 |
| fastmath | Russia | 2531 | 2599 | +68 | 26 |
AI period, January 2025 — June 2026:
| Handle | Country | Jan 2025 rating | Jun 2026 rating | Delta | Rated contests |
|---|---|---|---|---|---|
| kevin | United States | 2329 | 2364 | +35 | 32 |
| lethan3 | United States | 2266 | 1823 | -443 | 27 |
| I.Gleb | Germany | 2270 | 2192 | -78 | 19 |
| ub33 | Taiwan | 2170 | 2245 | +75 | 22 |
| harurun4635 | Japan | 2315 | 2746 | +431 | 37 |
| IHateGeometry | Netherlands | 2144 | 2261 | +117 | 15 |
| Jimanbanashi | Singapore | 2169 | 1692 | -477 | 61 |
| timg8710 | United States | 2168 | 1920 | -248 | 30 |
| n685 | United States | 2353 | 2145 | -208 | 17 |
| malachi_toney_goat | United States | 2339 | 2175 | -164 | 14 |
| JunkieDonkey | Georgia | 2237 | 2174 | -63 | 22 |
| mychecksdead | Turkey | 2178 | 2353 | +175 | 23 |
| Z_actuary | Japan | 2212 | 2347 | +135 | 16 |
| nitram | Austria | 2376 | 2434 | +58 | 27 |
| ian | South Korea | 2102 | 2480 | +378 | 19 |
| MagnusCarlsen321 | Kazakhstan | 2132 | 2021 | -111 | 37 |
| lsantire | Argentina | 2116 | 1765 | -351 | 26 |
| Kaey | Italy | 2203 | 2263 | +60 | 23 |
| tolbi | Turkey | 2341 | 2122 | -219 | 25 |
| p__ce1052 | South Korea | 2140 | 558 | -1582 | 40 |
| edogawa_something | Syria | 2272 | 1984 | -288 | 19 |
| ApraCadabra | Syria | 2320 | 2271 | -49 | 34 |
| polosatic | Russia | 2209 | 2036 | -173 | 23 |
| huangallen | Taiwan | 2310 | 2272 | -38 | 23 |
| Kustov_Vadim_533 | Russia | 2163 | 2215 | +52 | 23 |
| Pacybwoah | Taiwan | 2226 | 2372 | +146 | 17 |
| Edeeva | Indonesia | 2150 | 1955 | -195 | 31 |
| Dart-Xeyter | Russia | 2388 | 2338 | -50 | 27 |
| hengliao | Taiwan | 2299 | 2407 | +108 | 20 |
| Friedrich | Netherlands | 2123 | 2207 | +84 | 34 |
| C0DET1GER | United States | 2134 | 2161 | +27 | 15 |
| t98slider | Japan | 2201 | 2128 | -73 | 21 |
| shade34 | Cyprus | 2230 | 1758 | -472 | 45 |
| maomao90 | Singapore | 2344 | 2398 | +54 | 22 |
| oversolver | Russia | 2135 | 1853 | -282 | 13 |
| anpaio | Romania | 2364 | 2624 | +260 | 17 |
| nuip | Japan | 2376 | 2239 | -137 | 18 |
| irmuun | Mongolia | 2347 | 2237 | -110 | 28 |
| JakobZ | Slovenia | 2300 | 1972 | -328 | 23 |
| MatteoArcari | Italy | 2191 | 1773 | -418 | 32 |
| quaha | Russia | 2175 | 2093 | -82 | 18 |
| andreyDagger | Russia | 2281 | 2151 | -130 | 14 |
| MattTheNub | United States | 2385 | 2250 | -135 | 28 |
| minmise | Russia | 2199 | 1652 | -547 | 13 |
| dub-otrezkov | Russia | 2100 | 1813 | -287 | 26 |
| octane | South Korea | 2138 | 2044 | -94 | 26 |
| shinchankosen | Japan | 2383 | 2117 | -266 | 33 |
| awoo | Russia | 2208 | 2169 | -39 | 16 |
| KiKoS | France | 2192 | 2219 | +27 | 40 |
| Akulyat | France | 2376 | 2305 | -71 | 28 |
| askd | United States | 2271 | 2257 | -14 | 29 |
| guperman | Germany | 2232 | 1826 | -406 | 36 |
| OG_Matveychick1 | Russia | 2338 | 2406 | +68 | 30 |
| carcinisation | Turkey | 2381 | 2273 | -108 | 26 |
| annyeong1 | South Korea | 2197 | 2408 | +211 | 32 |
| dinohaur | Croatia | 2258 | 2287 | +29 | 16 |
| MohammadParsaElahimanesh | Iran | 2285 | 1870 | -415 | 20 |
| ali2005_syr | Syria | 2115 | 2016 | -99 | 23 |
| Gassa | Russia | 2186 | 2136 | -50 | 34 |
| Aestivate | Taiwan | 2342 | 2200 | -142 | 13 |
| mrthimote | France | 2205 | 2376 | +171 | 19 |
| Franuch | Poland | 2228 | 2261 | +33 | 17 |
| Gheal | Romania | 2170 | 2291 | +121 | 22 |
| timreizin | Ukraine | 2238 | 2099 | -139 | 26 |
| kafamcokkaristi | Turkey | 2234 | 2125 | -109 | 29 |
| UNDERTAKER | South Korea | 2319 | 2437 | +118 | 21 |
| Vectors_Master | Syria | 2331 | 1803 | -528 | 20 |
| dimash1 | Kazakhstan | 2159 | 1963 | -196 | 31 |
| FatihCihan | Turkey | 2129 | 2112 | -17 | 31 |
| MathGuy1729 | Slovakia | 2100 | 2299 | +199 | 14 |
| jamesbamber | Italy | 2127 | 2043 | -84 | 14 |
| _LeMur_ | Armenia | 2210 | 2140 | -70 | 24 |
| abs0lute | Russia | 2127 | 2165 | +38 | 25 |
| prins | Colombia | 2219 | 2160 | -59 | 27 |
| Kako | South Korea | 2359 | 2161 | -198 | 16 |
| CodigoL | Argentina | 2164 | 2147 | -17 | 36 |
| zenlog | Russia | 2234 | 2050 | -184 | 18 |
| Mitsubachi | Japan | 2312 | 2135 | -177 | 16 |
| Art.ogo | Belarus | 2164 | 2096 | -68 | 25 |
| teekaytai | Singapore | 2143 | 2131 | -12 | 33 |
| MarcosK | Argentina | 2219 | 2062 | -157 | 27 |
| A.D. | Syria | 2152 | 2084 | -68 | 25 |
| fishy15 | United States | 2181 | 2033 | -148 | 29 |
| Intellegent | United Kingdom | 2354 | 2408 | +54 | 13 |
| forest | Belarus | 2120 | 1838 | -282 | 31 |
| turska | Finland | 2173 | 2241 | +68 | 29 |
| DAleksa | Serbia | 2318 | 2202 | -116 | 25 |
| kalimm | Turkey | 2250 | 1876 | -374 | 44 |
| tinca_matei | Romania | 2187 | 2007 | -180 | 20 |
| SeptaCube | United States | 2308 | 2493 | +185 | 23 |
| NickMish | Russia | 2164 | 2422 | +258 | 24 |
| Prostoegor239 | Switzerland | 2108 | 1999 | -109 | 19 |
| SongC | South Korea | 2363 | 2505 | +142 | 18 |
| Edu175 | Argentina | 2233 | 2343 | +110 | 25 |
| amirhoseinfar1385 | Iran | 2384 | 2425 | +41 | 29 |
| qusol | Germany | 2180 | 2425 | +245 | 26 |
| Romy67 | Indonesia | 2193 | 1917 | -276 | 22 |
| is_i | Kazakhstan | 2214 | 1993 | -221 | 16 |
| Tima | Kazakhstan | 2331 | 2110 | -221 | 16 |
| goats_9 | New Zealand | 2169 | 1806 | -363 | 77 |
| FelixMP | Spain | 2263 | 2094 | -169 | 40 |
| medmdg_3 | Morocco | 2150 | 2278 | +128 | 22 |
| ezraft | United States | 2238 | 2199 | -39 | 23 |
| francesco | Italy | 2286 | 2217 | -69 | 16 |
| snowysecret | Hong Kong | 2368 | 2199 | -169 | 32 |
| zsombor | Hungary | 2174 | 1882 | -292 | 15 |
| reil_st | Japan | 2214 | 2431 | +217 | 33 |
| GOTKAKO | Japan | 2348 | 2262 | -86 | 38 |
| burg113 | Germany | 2189 | 2215 | +26 | 18 |
| DanielChang | United States | 2386 | 2323 | -63 | 32 |
| MvKaio | Brazil | 2261 | 2108 | -153 | 22 |
| tfg | Brazil | 2396 | 2133 | -263 | 26 |
| MateoCV | Argentina | 2256 | 2256 | 0 | 15 |
| PieArmy | Turkey | 2200 | 2043 | -157 | 26 |
| NekoRolly | Peru | 2126 | 1801 | -325 | 15 |
| GrandTiger1729 | Taiwan | 2275 | 2177 | -98 | 14 |
| mjtai | Japan | 2178 | 1932 | -246 | 25 |
Pre-AI period, January 2023 — June 2024:
| Handle | Country | Jan 2023 rating | Jun 2024 rating | Delta | Rated contests |
|---|---|---|---|---|---|
| Wielomian | Poland | 2196 | 2220 | +24 | 24 |
| w4p3r | Guinea-Bissau | 2288 | 2308 | +20 | 32 |
| AntiBsayer | Jordan | 2329 | 2493 | +164 | 20 |
| ParsaS | Iran | 2293 | 2123 | -170 | 25 |
| pavement | Singapore | 2305 | 2245 | -60 | 16 |
| Nika_Tamliani | Georgia | 2125 | 2164 | +39 | 24 |
| paula | Croatia | 2213 | 2265 | +52 | 21 |
| n0sk1ll | Serbia | 2149 | 1967 | -182 | 20 |
| info | Namibia | 2187 | 2328 | +141 | 19 |
| Gassa | Russia | 2279 | 2395 | +116 | 35 |
| HaccerKat | Canada | 2185 | 2075 | -110 | 27 |
| prins | Colombia | 2120 | 2304 | +184 | 29 |
| snowysecret | Hong Kong | 2260 | 2422 | +162 | 22 |
| siganai | Japan | 2325 | 2524 | +199 | 36 |
| LuCpp | Germany | 2391 | 2551 | +160 | 24 |
| pacha2880 | Bolivia | 2123 | 1770 | -353 | 36 |
| rembocoder | Russia | 2284 | 2365 | +81 | 20 |
| 74TrAkToR | Russia | 2380 | 2502 | +122 | 18 |
| Weobe | Turkey | 2155 | 2177 | +22 | 21 |
| Theo830 | Cyprus | 2269 | 2289 | +20 | 24 |
| Gheal | Romania | 2324 | 2111 | -213 | 23 |
| jason_sun | United States | 2216 | 2408 | +192 | 20 |
| Zanite | Indonesia | 2186 | 2447 | +261 | 15 |
| AmirrzwM | Iran | 2180 | 2151 | -29 | 23 |
| SorahISA | Taiwan | 2100 | 2410 | +310 | 16 |
| MtSaka | Japan | 2291 | 2263 | -28 | 15 |
| MohammadParsaElahimanesh | Iran | 2159 | 2294 | +135 | 24 |
| pooty | Singapore | 2355 | 2469 | +114 | 42 |
| malachi_toney_goat | United States | 2107 | 2245 | +138 | 34 |
| libobil | Bulgaria | 2132 | 2512 | +380 | 27 |
| zwezdinv | Russia | 2111 | 2444 | +333 | 17 |
| henotrix | Taiwan | 2292 | 2215 | -77 | 12 |
| CodigoL | Argentina | 2151 | 2137 | -14 | 19 |
| MAKMED1337 | Ukraine | 2255 | 2427 | +172 | 31 |
| mychecksdead | Turkey | 2174 | 2159 | -15 | 26 |
| TKT_YI | Japan | 2215 | 2519 | +304 | 38 |
| JunkieDonkey | Georgia | 2161 | 2161 | 0 | 25 |
| -1e11 | Taiwan | 2289 | 2221 | -68 | 15 |
| maomao90 | Singapore | 2388 | 2552 | +164 | 29 |
| Tima | Kazakhstan | 2282 | 2271 | -11 | 24 |
| Misuki | Taiwan | 2147 | 2276 | +129 | 31 |
| jophyyjh | Macao | 2120 | 1753 | -367 | 17 |
| lsantire | Argentina | 2132 | 2182 | +50 | 29 |
| ToniB | Croatia | 2201 | 2367 | +166 | 14 |
| turkhuu622 | Mongolia | 2137 | 2273 | +136 | 40 |
| green_gold_dog | Russia | 2168 | 2626 | +458 | 13 |
| Puranya | Japan | 2384 | 2515 | +131 | 17 |
| knightL | Russia | 2160 | 2486 | +326 | 16 |
| Denisov | Ukraine | 2238 | 2505 | +267 | 18 |
| guperman | Germany | 2162 | 2161 | -1 | 35 |
| 7etuPr0mK_X-VPA.8-ER1SYJ | Antarctica | 2233 | 2430 | +197 | 15 |
| okwedook | Russia | 2317 | 2251 | -66 | 27 |
| tem_shett | Russia | 2200 | 2225 | +25 | 19 |
| p0tato | Hong Kong | 2359 | 2354 | -5 | 31 |
| Valera_Grinenko | Ukraine | 2114 | 2319 | +205 | 17 |
| titia | Japan | 2190 | 2153 | -37 | 31 |
| dkhve | Georgia | 2122 | 2242 | +120 | 37 |
| Ayalla | Brazil | 2101 | 1924 | -177 | 30 |
| mQfZ | United States | 2167 | 2146 | -21 | 28 |
| Siberian | Russia | 2390 | 2536 | +146 | 15 |
| lukameladze1 | Georgia | 2108 | 1952 | -156 | 17 |
| erankyun | Armenia | 2153 | 1985 | -168 | 22 |
| ikaurov | United States | 2395 | 2556 | +161 | 20 |
| cmk666 | Antarctica | 2188 | 2708 | +520 | 30 |
| arvindr9 | Antarctica | 2111 | 2147 | +36 | 26 |
| Sorting | Bulgaria | 2398 | 2466 | +68 | 34 |
| lotusblume | Germany | 2113 | 2295 | +182 | 38 |
| Rafi22 | Poland | 2377 | 2377 | 0 | 23 |
| magnified | Antarctica | 2113 | 2239 | +126 | 32 |
| AmirAli-Asgari | Iran | 2156 | 2472 | +316 | 37 |
| VladaMG98 | Serbia | 2157 | 2226 | +69 | 24 |
| Kaey | Italy | 2252 | 2199 | -53 | 31 |
| Jimanbanashi | Singapore | 2327 | 2061 | -266 | 36 |
| middle_man | South Korea | 2320 | 2543 | +223 | 38 |
| atodo | Romania | 2315 | 2238 | -77 | 20 |
| FEDIKUS | Serbia | 2113 | 2303 | +190 | 14 |
| DanTheMan. | United States | 2305 | 2349 | +44 | 28 |
| mban259 | Japan | 2175 | 2193 | +18 | 39 |
| Prostoegor239 | Switzerland | 2253 | 2128 | -125 | 19 |
| LoboLobo | Brazil | 2238 | 2062 | -176 | 35 |
| ParsaDox | Iran | 2104 | 2487 | +383 | 32 |
| irmuun | Mongolia | 2218 | 2321 | +103 | 40 |
| fishy15 | United States | 2226 | 2222 | -4 | 23 |
| KumaTachiRen | Japan | 2256 | 2439 | +183 | 28 |
| shobonvip | Japan | 2220 | 2437 | +217 | 31 |
| Qwerty1232 | Russia | 2385 | 2529 | +144 | 19 |
| ivatopuria | Georgia | 2109 | 2287 | +178 | 31 |
| ace5 | Russia | 2316 | 2532 | +216 | 35 |
| andrei_boaca | Romania | 2251 | 2565 | +314 | 23 |
| sevlll777 | Niue | 2159 | 2367 | +208 | 37 |
| antonis.white | Russia | 2255 | 2454 | +199 | 14 |
| mjtai | Japan | 2238 | 2137 | -101 | 42 |
| menborong | South Korea | 2144 | 2349 | +205 | 30 |
| FelixMP | Spain | 2107 | 2174 | +67 | 26 |
| borgar02 | Romania | 2268 | 2073 | -195 | 30 |
| plast | South Korea | 2269 | 2406 | +137 | 27 |
| bashkort | Russia | 2336 | 2760 | +424 | 22 |
| Serendipity__ | South Korea | 2102 | 2137 | +35 | 40 |
| Vectors_Master | Syria | 2143 | 2209 | +66 | 41 |
| imirdy | Germany | 2203 | 2434 | +231 | 27 |
| dranjohn | Germany | 2252 | 2194 | -58 | 21 |
| _LeMur_ | Armenia | 2198 | 2338 | +140 | 39 |
| lightseba | United States | 2344 | 2321 | -23 | 33 |
| Sofapuden | Denmark | 2181 | 2488 | +307 | 19 |
| steven.novaryo | Indonesia | 2242 | 2050 | -192 | 12 |
| defnotmee | Brazil | 2253 | 2328 | +75 | 20 |
| noya2 | Japan | 2179 | 2576 | +397 | 38 |
| I.Gleb | Germany | 2313 | 2215 | -98 | 21 |
| Vladithur | Antarctica | 2101 | 2415 | +314 | 17 |
| ub33 | Taiwan | 2221 | 2162 | -59 | 30 |
| TheScrasse | Italy | 2226 | 2566 | +340 | 30 |
| t98slider | Japan | 2152 | 2138 | -14 | 46 |
| kalimm | Turkey | 2226 | 2237 | +11 | 31 |
AI period, January 2025 — June 2026:
| Handle | Country | Jan 2025 rating | Jun 2026 rating | Delta | Rated contests |
|---|---|---|---|---|---|
| ibrm | Kazakhstan | 1927 | 1715 | -212 | 70 |
| cherryk | Ukraine | 2054 | 1931 | -123 | 31 |
| Gogolev | Russia | 1924 | 1757 | -167 | 46 |
| N00BGH0ST | Russia | 2006 | 1984 | -22 | 28 |
| fisher199 | Costa Rica | 1906 | 2101 | +195 | 50 |
| SkillIssueWABird | Canada | 1926 | 2240 | +314 | 24 |
| k_san | South Korea | 1911 | 1965 | +54 | 41 |
| kinnikuma | France | 1982 | 1726 | -256 | 32 |
| ococonomy1 | Japan | 1979 | 2167 | +188 | 47 |
| Glac1er | Hungary | 1902 | 1943 | +41 | 48 |
| rt200505 | Taiwan | 1902 | 1766 | -136 | 15 |
| overnap | South Korea | 1999 | 1937 | -62 | 43 |
| vlp | Russia | 2066 | 1917 | -149 | 36 |
| wjli | United States | 1936 | 1521 | -415 | 33 |
| pupilemus | Mexico | 2046 | 2075 | +29 | 23 |
| Geforgs | Ukraine | 1926 | 2214 | +288 | 39 |
| naneosmic | Bosnia and Herzegovina | 1959 | 1902 | -57 | 25 |
| Franchu | Argentina | 1948 | 1829 | -119 | 29 |
| pera2008 | Georgia | 1939 | 2101 | +162 | 24 |
| twosquares | United States | 1979 | 2128 | +149 | 41 |
| RaresPoinaru | Romania | 1914 | 2278 | +364 | 33 |
| hugo4CF | Poland | 1970 | 1699 | -271 | 31 |
| Sakamata_ | Japan | 2081 | 2363 | +282 | 24 |
| Lilypad | United States | 2051 | 2097 | +46 | 22 |
| JakovJ | Croatia | 1978 | 1631 | -347 | 35 |
| BERNARB.01 | Syria | 2011 | 1738 | -273 | 62 |
| ezluci | Romania | 2032 | 2120 | +88 | 40 |
| Arch_of_Triumph | Kazakhstan | 2012 | 1942 | -70 | 13 |
| nzo | Brazil | 1954 | 1806 | -148 | 49 |
| Rice_tawara459 | Japan | 2087 | 2308 | +221 | 14 |
| Alex239 | Canada | 2036 | 2076 | +40 | 43 |
| Razvan_Rotaru | Romania | 1934 | 2147 | +213 | 33 |
| d1mk | Serbia | 1946 | 2056 | +110 | 42 |
| I_am_Domik | Russia | 1968 | 2058 | +90 | 47 |
| bubbarob19 | United States | 1950 | 1895 | -55 | 18 |
| AlRntn | Iran | 2006 | 2341 | +335 | 35 |
| HoriaB | Romania | 2021 | 1810 | -211 | 33 |
| dankakon | Russia | 2001 | 1792 | -209 | 38 |
| larionov_kirill | Russia | 1966 | 2084 | +118 | 22 |
| Katu2ou | Japan | 1976 | 1732 | -244 | 37 |
| juneharold | South Korea | 1920 | 1964 | +44 | 53 |
| purplelemon | Iran | 1911 | 1950 | +39 | 13 |
| sashko123 | Ukraine | 2037 | 1985 | -52 | 31 |
| HusseinFarhat | Lebanon | 2031 | 2179 | +148 | 52 |
| nathanballman | United States | 2091 | 2103 | +12 | 16 |
| egge | Netherlands | 2039 | 2032 | -7 | 34 |
| kdy8128 | South Korea | 1954 | 2273 | +319 | 30 |
| sqrteipi | Hong Kong | 1986 | 1913 | -73 | 30 |
| hcng | Macao | 1971 | 1864 | -107 | 28 |
| zhangtianhan | Hong Kong | 2006 | 1690 | -316 | 27 |
| MOUFLESS | Syria | 2007 | 1856 | -151 | 43 |
| luka.heric | Slovenia | 1920 | 2344 | +424 | 18 |
| pengin_2000 | Japan | 1937 | 1797 | -140 | 69 |
| mircea_007 | Romania | 2097 | 2378 | +281 | 13 |
| kmchoi | South Korea | 1973 | 1582 | -391 | 31 |
| igeee | Japan | 1937 | 1924 | -13 | 46 |
| FinrodF | Serbia | 2063 | 2071 | +8 | 14 |
| besukohu | Japan | 2013 | 1994 | -19 | 35 |
| Cyber | United Kingdom | 1951 | 1573 | -378 | 68 |
| SPD_9X2 | Japan | 2022 | 1960 | -62 | 16 |
| turneja | Serbia | 1958 | 2444 | +486 | 30 |
| adam.jq.xu | Hong Kong | 1915 | 2565 | +650 | 31 |
| bcollet | France | 2085 | 1964 | -121 | 29 |
| Mox_Taest3r | Russia | 1930 | 1635 | -295 | 57 |
| Valters07 | Latvia | 2016 | 2117 | +101 | 23 |
| Chifwin | Kazakhstan | 1963 | 1711 | -252 | 30 |
| LordVoIdebug | Russia | 1966 | 1822 | -144 | 40 |
| ALAov | Syria | 2098 | 1721 | -377 | 50 |
| qwe1rt1yuiop1 | Taiwan | 1932 | 1977 | +45 | 24 |
| Magician_Mathematician | Syria | 1942 | 1686 | -256 | 41 |
| MrAndria | Georgia | 2001 | 2040 | +39 | 57 |
| leg | Malaysia | 2007 | 2377 | +370 | 38 |
| Zicrus | Denmark | 1979 | 2144 | +165 | 27 |
| StefanSebez | Serbia | 1908 | 1742 | -166 | 22 |
| AcPlusOne | Kyrgyzstan | 1989 | 1452 | -537 | 38 |
| anotherworld | Russia | 1930 | 1906 | -24 | 18 |
| employed | Jordan | 2052 | 2316 | +264 | 25 |
| azure- | United States | 1947 | 1930 | -17 | 17 |
| zsmihaly | Hungary | 1937 | 2344 | +407 | 23 |
| naumovRD | Japan | 1926 | 1695 | -231 | 18 |
| vako_P | Georgia | 2004 | 2088 | +84 | 67 |
| mariza_CY | Cyprus | 2007 | 1883 | -124 | 26 |
| Left0807 | Hong Kong | 2079 | 1679 | -400 | 52 |
| amsraman | United States | 2086 | 2041 | -45 | 37 |
| mban259 | Japan | 2045 | 1763 | -282 | 58 |
| Rising-coder | Syria | 1973 | 2067 | +94 | 72 |
| Denislav_Manev | Bulgaria | 1953 | 2106 | +153 | 16 |
| Pekiban | Serbia | 1990 | 2002 | +12 | 24 |
| DaNeK0201 | Ukraine | 2029 | 1919 | -110 | 31 |
| Timosh | Uzbekistan | 2010 | 2103 | +93 | 47 |
| Aldk | Kazakhstan | 2065 | 2425 | +360 | 33 |
| Dmitry345s | Russia | 1918 | 1898 | -20 | 28 |
| SnowLucario_Z | Canada | 1987 | 1877 | -110 | 43 |
| pyspobo | South Korea | 1995 | 1843 | -152 | 36 |
| JahonaliX | Uzbekistan | 1910 | 2004 | +94 | 74 |
| yupooh | Japan | 1938 | 1633 | -305 | 75 |
| yamate11 | Japan | 1901 | 1638 | -263 | 39 |
| aIish | Kazakhstan | 1914 | 1750 | -164 | 38 |
| real_cupsize | Japan | 1963 | 1927 | -36 | 15 |
| CIXTEEN | United States | 1921 | 1641 | -280 | 35 |
| ItsNotMeItsYou | Turkey | 2040 | 2220 | +180 | 31 |
| kissgergely | Hungary | 1962 | 1774 | -188 | 37 |
| diss_quack | United States | 2056 | 1969 | -87 | 20 |
| antguz | Poland | 1911 | 1564 | -347 | 59 |
| jankos19 | Poland | 1945 | 2013 | +68 | 13 |
| l-_-l | Russia | 2022 | 2054 | +32 | 33 |
| wery0 | Russia | 2098 | 1848 | -250 | 32 |
| Tyanochka | Russia | 1962 | 2059 | +97 | 13 |
| perchuts | Brazil | 2020 | 2100 | +80 | 22 |
| Horka | Hungary | 1995 | 2109 | +114 | 54 |
| Soultaker | Netherlands | 1945 | 1644 | -301 | 47 |
| __Maksik__ | Russia | 1923 | 1620 | -303 | 24 |
| 1075508020060209tc | Taiwan | 2052 | 1526 | -526 | 14 |
| Nika533 | Georgia | 2071 | 1747 | -324 | 37 |
| zabiyakaubivaka | Russia | 2098 | 2209 | +111 | 21 |
| Apteryxx | United States | 2068 | 2006 | -62 | 27 |
| gs17005 | South Korea | 1916 | 1578 | -338 | 64 |
| Pagode_Paiva | Brazil | 2087 | 1911 | -176 | 19 |
| _Filya_ | Belarus | 1937 | 1934 | -3 | 37 |
| jununu0811 | South Korea | 2087 | 1967 | -120 | 38 |
| Dalek_of_Rivia | Spain | 1995 | 2287 | +292 | 33 |
| XDEv11 | Taiwan | 1913 | 1765 | -148 | 89 |
| gyouzasushi | Japan | 2071 | 1790 | -281 | 25 |
| eriri__ | Russia | 1917 | 2113 | +196 | 32 |
| ThatOnePythonUser | South Korea | 2025 | 1881 | -144 | 33 |
| NotDWT | Russia | 1982 | 2201 | +219 | 34 |
Pre-AI period, January 2023 — June 2024:
| Handle | Country | Jan 2023 rating | Jun 2024 rating | Delta | Rated contests |
|---|---|---|---|---|---|
| makrav | Russia | 1915 | 2441 | +526 | 29 |
| fossil823656 | Ukraine | 2031 | 2037 | +6 | 40 |
| keisuke6 | Japan | 2066 | 2405 | +339 | 33 |
| ApraCadabra | Syria | 1993 | 2181 | +188 | 37 |
| Nevll | Indonesia | 1990 | 2195 | +205 | 24 |
| someone__ | Japan | 1906 | 2166 | +260 | 36 |
| DaNeK0201 | Ukraine | 2029 | 1976 | -53 | 42 |
| bcollet | France | 1974 | 1975 | +1 | 25 |
| brimix__ | Argentina | 1991 | 2022 | +31 | 33 |
| brown_toad | Taiwan | 1903 | 2163 | +260 | 23 |
| EMBailey | United States | 2090 | 2207 | +117 | 25 |
| gotexans | United States | 1999 | 2169 | +170 | 39 |
| cjoa | Dominican Republic | 1981 | 1816 | -165 | 45 |
| misteg168 | Spain | 1903 | 2219 | +316 | 18 |
| ScarletS | Ireland | 2093 | 2081 | -12 | 77 |
| PauloMiranda98 | Brazil | 2053 | 1905 | -148 | 13 |
| perchuts | Brazil | 2006 | 2175 | +169 | 56 |
| eggag32 | United States | 1904 | 2124 | +220 | 31 |
| Scalm | United States | 1921 | 1915 | -6 | 40 |
| Tagl | Iceland | 1975 | 1759 | -216 | 26 |
| hopele555 | Estonia | 2089 | 2264 | +175 | 34 |
| IzhitskiyTimofey | Russia | 2035 | 2321 | +286 | 17 |
| LordVoIdebug | Russia | 2005 | 2117 | +112 | 14 |
| EJIC_B_KEDAX | Russia | 1989 | 2479 | +490 | 38 |
| Agnus | Croatia | 2089 | 2148 | +59 | 15 |
| JustNik77 | Russia | 2000 | 2174 | +174 | 24 |
| Cegax | Peru | 2096 | 2182 | +86 | 39 |
| nnv-nick | Russia | 1942 | 1891 | -51 | 24 |
| Tainel | Argentina | 1926 | 1960 | +34 | 36 |
| APMAH | Kazakhstan | 1908 | 1853 | -55 | 43 |
| amirhoseinfar1385 | Iran | 2070 | 2410 | +340 | 44 |
| ikrpprppp | Cyprus | 2054 | 2177 | +123 | 33 |
| xpov1LL | Spain | 2018 | 2218 | +200 | 19 |
| GrandTiger1729 | Taiwan | 1922 | 2278 | +356 | 23 |
| ABalobanov | Russia | 2076 | 2023 | -53 | 35 |
| espr1t | Bulgaria | 1911 | 1827 | -84 | 53 |
| STommydx | Hong Kong | 1996 | 1996 | 0 | 69 |
| miss_robot | Germany | 2057 | 2209 | +152 | 14 |
| kzyKT | Japan | 2047 | 2043 | -4 | 102 |
| wery0 | Russia | 1981 | 2208 | +227 | 18 |
| great_fortune | Serbia | 1927 | 2164 | +237 | 71 |
| status_coding | Romania | 1931 | 2273 | +342 | 29 |
| shakhnoov | Belarus | 1909 | 2138 | +229 | 56 |
| areke | United States | 1961 | 1856 | -105 | 63 |
| JustasZ | Lithuania | 1989 | 1947 | -42 | 33 |
| egge | Netherlands | 2009 | 2139 | +130 | 36 |
| Popusk3000lvl | Ukraine | 1914 | 1962 | +48 | 39 |
| v0s7er | Russia | 1968 | 1966 | -2 | 24 |
| AceIn | Taiwan | 2016 | 2024 | +8 | 16 |
| yupooh | Japan | 2060 | 2244 | +184 | 70 |
| Mahmoud_Haddad | Syria | 1966 | 2032 | +66 | 43 |
| RGB_ICPC6 | North Korea | 2013 | 1808 | -205 | 14 |
| Arch_of_Triumph | Kazakhstan | 1922 | 1977 | +55 | 42 |
| anpaio | Romania | 2031 | 2249 | +218 | 19 |
| purinliang | Australia | 1968 | 1948 | -20 | 45 |
| trainerherp | Indonesia | 1917 | 1496 | -421 | 36 |
| kwoncycle | South Korea | 1996 | 2157 | +161 | 44 |
| Wibo | Indonesia | 1926 | 1762 | -164 | 34 |
| parsa-golestani | Iran | 1989 | 2276 | +287 | 37 |
| Igor_Parfenov | Russia | 2055 | 2167 | +112 | 49 |
| antguz | Poland | 1961 | 1964 | +3 | 28 |
| tch1cherin | Russia | 2059 | 2186 | +127 | 53 |
| MvKaio | Brazil | 2093 | 2166 | +73 | 32 |
| M_bolshakov | Russia | 1973 | 2166 | +193 | 42 |
| Issa | Kazakhstan | 1905 | 2102 | +197 | 48 |
| JYJin | South Korea | 2054 | 2283 | +229 | 37 |
| ezraft | United States | 1961 | 2087 | +126 | 47 |
| daniel071292 | Taiwan | 1976 | 2093 | +117 | 35 |
| cebolinha | Brazil | 1918 | 2311 | +393 | 30 |
| XDEv11 | Taiwan | 1996 | 1959 | -37 | 93 |
| el_programador | Bolivia | 1956 | 1659 | -297 | 29 |
| DimmyT | Kazakhstan | 2032 | 2170 | +138 | 29 |
| tolbi | Turkey | 1962 | 2249 | +287 | 68 |
| RP-1 | Russia | 2098 | 2442 | +344 | 18 |
| kolomig0r | Russia | 2026 | 2139 | +113 | 26 |
| Kolychestiy | Russia | 1955 | 2214 | +259 | 19 |
| Gamicrab | Kazakhstan | 2013 | 2153 | +140 | 38 |
| vito1036 | Croatia | 1989 | 2101 | +112 | 23 |
| awesomeguy856 | United States | 1916 | 2230 | +314 | 22 |
| khangai11 | Mongolia | 1968 | 1973 | +5 | 42 |
| akua | Japan | 1987 | 2176 | +189 | 71 |
| DanielChang | United States | 1987 | 2306 | +319 | 30 |
| Edlue | United States | 2010 | 2263 | +253 | 30 |
| A.D. | Syria | 1921 | 2111 | +190 | 45 |
| _rey | Brazil | 1961 | 2261 | +300 | 29 |
| CIXTEEN | United States | 1901 | 1898 | -3 | 51 |
| vladmart | Russia | 2067 | 2168 | +101 | 38 |
| The_Hallak | Syria | 2046 | 2093 | +47 | 44 |
| gortomi | Hungary | 1976 | 2116 | +140 | 17 |
| abs0lute | Russia | 1923 | 1691 | -232 | 36 |
| DylanSmith | United States | 1917 | 2375 | +458 | 31 |
| Tatsuyaaaa | Japan | 1937 | 1799 | -138 | 51 |
| Valters07 | Latvia | 2041 | 2184 | +143 | 31 |
| Jonas01234500 | Germany | 2038 | 2188 | +150 | 55 |
AI period, January 2025 — June 2026:
| Handle | Country | Jan 2025 rating | Jun 2026 rating | Delta | Rated contests |
|---|---|---|---|---|---|
| Ra_ist | Croatia | 1677 | 1568 | -109 | 32 |
| jonatas57 | Brazil | 1725 | 1451 | -274 | 38 |
| neugis | Kazakhstan | 1681 | 1495 | -186 | 28 |
| BlueMoon. | Jordan | 1727 | 1833 | +106 | 41 |
| Escapisst | Kyrgyzstan | 1655 | 2008 | +353 | 30 |
| MunkhturErdenebat | Mongolia | 1763 | 1813 | +50 | 52 |
| ivopav1 | Croatia | 1898 | 2036 | +138 | 35 |
| Lechaa | Indonesia | 1606 | 1668 | +62 | 21 |
| is_it_interactive | South Korea | 1780 | 1657 | -123 | 73 |
| Caceres.Nikita | Russia | 1656 | 1898 | +242 | 18 |
| Petricore | Italy | 1670 | 1572 | -98 | 44 |
| HubertM6 | Poland | 1728 | 1975 | +247 | 40 |
| susvent | United States | 1845 | 1626 | -219 | 23 |
| MarioYC | Peru | 1831 | 1683 | -148 | 64 |
| Kraska | Russia | 1617 | 1969 | +352 | 29 |
| KindaGoodGames | Germany | 1621 | 1549 | -72 | 50 |
| PoDuReMaN | Russia | 1852 | 1899 | +47 | 29 |
| cr7ro | South Korea | 1859 | 1636 | -223 | 25 |
| Godgift42 | Greece | 1676 | 1723 | +47 | 47 |
| Se7enn | United States | 1610 | 1517 | -93 | 23 |
| Logically_Notexpert | Syria | 1630 | 1542 | -88 | 71 |
| SkillZz_ | Russia | 1693 | 1680 | -13 | 42 |
| salvini_god | Italy | 1789 | 1657 | -132 | 71 |
| Revuelto | Italy | 1640 | 2221 | +581 | 20 |
| dt1ft | Russia | 1642 | 1650 | +8 | 16 |
| SpyrosAliv | Greece | 1869 | 1923 | +54 | 58 |
| kindmango | United States | 1875 | 1950 | +75 | 55 |
| reiracofage | Brazil | 1622 | 1432 | -190 | 32 |
| AlphaMale06 | Serbia | 1635 | 1772 | +137 | 37 |
| rockoff | Russia | 1851 | 1480 | -371 | 33 |
| danielrmzkuhn1 | Mexico | 1629 | 1471 | -158 | 28 |
| TeletubiGaim33 | Latvia | 1753 | 2189 | +436 | 68 |
| Kleder | South Korea | 1649 | 2274 | +625 | 36 |
| Lord_Wrongmort | Syria | 1661 | 1517 | -144 | 22 |
| lxnu | Russia | 1687 | 1676 | -11 | 15 |
| homm9k | Russia | 1654 | 1500 | -154 | 72 |
| kzyKT | Japan | 1835 | 1691 | -144 | 95 |
| Nastya_An | Russia | 1812 | 1709 | -103 | 52 |
| ABalobanov | Russia | 1835 | 2143 | +308 | 25 |
| mythofys | South Korea | 1760 | 2095 | +335 | 45 |
| paulo.pr | Brazil | 1635 | 1938 | +303 | 54 |
| mtand872 | United States | 1667 | 1850 | +183 | 21 |
| fuxh | Italy | 1852 | 1778 | -74 | 29 |
| Nari0222 | Mongolia | 1612 | 1783 | +171 | 43 |
| Muhannadooov | Syria | 1661 | 1621 | -40 | 35 |
| t6stks | Taiwan | 1722 | 1735 | +13 | 17 |
| dio_2 | Poland | 1802 | 1607 | -195 | 26 |
| Grizoo | Syria | 1690 | 1861 | +171 | 60 |
| Aidencode | Taiwan | 1633 | 1423 | -210 | 40 |
| nella17 | Taiwan | 1666 | 1674 | +8 | 19 |
| aminjon__ | Tajikistan | 1744 | 1720 | -24 | 51 |
| maratzabivnoy1337 | Russia | 1656 | 2051 | +395 | 22 |
| Abilmansur-007 | Kazakhstan | 1784 | 2134 | +350 | 26 |
| xksark | Kazakhstan | 1703 | 1585 | -118 | 56 |
| Pagesh | Brazil | 1623 | 1707 | +84 | 29 |
| romarkovets | Belarus | 1820 | 1655 | -165 | 34 |
| enzy.enzy | Brazil | 1852 | 1978 | +126 | 18 |
| Rybka21 | Luxembourg | 1864 | 1782 | -82 | 36 |
| yottabot | United Kingdom | 1765 | 1427 | -338 | 28 |
| Jensen123 | United States | 1732 | 2163 | +431 | 81 |
| Luvinz | Latvia | 1608 | 1464 | -144 | 32 |
| j30 | Peru | 1626 | 1523 | -103 | 44 |
| sabino1 | Brazil | 1783 | 1983 | +200 | 78 |
| IceSerpent | United States | 1662 | 1694 | +32 | 48 |
| 34z12000 | Russia | 1853 | 1734 | -119 | 30 |
| ChirkovM | Russia | 1603 | 1620 | +17 | 21 |
| davit_tsibadze | Georgia | 1777 | 1858 | +81 | 24 |
| APMAH | Kazakhstan | 1867 | 1753 | -114 | 31 |
| alternn | Indonesia | 1723 | 2021 | +298 | 37 |
| harvsftw | Philippines | 1634 | 1711 | +77 | 87 |
| detteiuu | Japan | 1863 | 2015 | +152 | 61 |
| DigitalVest | Canada | 1669 | 2271 | +602 | 32 |
| Darius1414 | Romania | 1625 | 2192 | +567 | 17 |
| VladiG | North Macedonia | 1824 | 2367 | +543 | 23 |
| omikad | Netherlands | 1761 | 1523 | -238 | 33 |
| ryansmg | South Korea | 1863 | 1825 | -38 | 21 |
| Ivanorey | Mexico | 1698 | 1497 | -201 | 16 |
| _Kee | Japan | 1783 | 1649 | -134 | 96 |
| Husanboy | Uzbekistan | 1832 | 1756 | -76 | 42 |
| gohard | Russia | 1718 | 1323 | -395 | 58 |
| kazu_tech | Japan | 1665 | 1705 | +40 | 59 |
| meow_love | South Korea | 1677 | 1601 | -76 | 57 |
| TheFuturoma | Ukraine | 1845 | 2097 | +252 | 38 |
| jastaway | Japan | 1863 | 1779 | -84 | 68 |
| uiopy1 | South Korea | 1611 | 1660 | +49 | 58 |
| Cabralbonzao | Brazil | 1844 | 1691 | -153 | 42 |
| Sanya239 | Russia | 1739 | 1857 | +118 | 31 |
| cjoa | Dominican Republic | 1802 | 1588 | -214 | 38 |
| KluydQ | Kazakhstan | 1736 | 1957 | +221 | 53 |
| britishcat | Poland | 1806 | 1656 | -150 | 44 |
| Marko | Serbia | 1606 | 1737 | +131 | 37 |
| kikitop1gg | Czechia | 1673 | 1884 | +211 | 26 |
| 0gur4ik | Uzbekistan | 1827 | 1839 | +12 | 40 |
| _totoro | New Zealand | 1680 | 2059 | +379 | 40 |
| stdfloat | Turkmenistan | 1801 | 1625 | -176 | 31 |
| Sacha | Belarus | 1742 | 1728 | -14 | 55 |
| Abito | Syria | 1669 | 1586 | -83 | 27 |
| bramar2 | Indonesia | 1683 | 1668 | -15 | 47 |
| andrei_n | Romania | 1616 | 1963 | +347 | 20 |
| IceWolf898 | United States | 1849 | 1834 | -15 | 21 |
| veks_the_boss | Serbia | 1690 | 1538 | -152 | 19 |
| VanyaM1 | Russia | 1743 | 1939 | +196 | 18 |
| kaichou243 | Japan | 1779 | 2255 | +476 | 12 |
| ParsaFarin | Iran | 1635 | 1688 | +53 | 55 |
| sdiego | Italy | 1684 | 1639 | -45 | 25 |
| AndreasK | Cyprus | 1725 | 1743 | +18 | 70 |
| eolienne | Ireland | 1621 | 1808 | +187 | 21 |
| hanchangseo | South Korea | 1811 | 1743 | -68 | 11 |
| QazLon | Kazakhstan | 1672 | 1947 | +275 | 50 |
| dssfsuper2 | France | 1767 | 1842 | +75 | 20 |
| IanISam | United States | 1851 | 1873 | +22 | 55 |
| alexalvarez123 | Bolivia | 1602 | 1590 | -12 | 22 |
| anteknne2 | Poland | 1678 | 2276 | +598 | 28 |
| julia_08 | Brazil | 1600 | 1773 | +173 | 42 |
| yusuf12360 | Indonesia | 1811 | 1774 | -37 | 45 |
| MarcosPauloEvers | Brazil | 1753 | 1796 | +43 | 20 |
| no_mind | Colombia | 1636 | 1574 | -62 | 21 |
| skinnyasiandude | Hong Kong | 1675 | 1481 | -194 | 55 |
| CatsAreCool | United States | 1813 | 1934 | +121 | 35 |
| Teto | Mexico | 1822 | 1042 | -780 | 52 |
| fedosbot123 | Belarus | 1618 | 1862 | +244 | 26 |
| kizu | Japan | 1649 | 1849 | +200 | 32 |
| CYhuang | Taiwan | 1679 | 1646 | -33 | 57 |
| rohitjazz199955 | United States | 1621 | 1442 | -179 | 52 |
| Leonardo_Paes | Brazil | 1764 | 1831 | +67 | 47 |
| Focti20 | Russia | 1769 | 1980 | +211 | 49 |
| gabriel | Brazil | 1661 | 1759 | +98 | 46 |
| se_tsu_na | Japan | 1724 | 1611 | -113 | 76 |
| asdasdqwer | Germany | 1855 | 1830 | -25 | 52 |
| vid | Slovenia | 1657 | 2157 | +500 | 45 |
| Dibamboo | Kazakhstan | 1677 | 1382 | -295 | 29 |
| meisgood | Hong Kong | 1816 | 1705 | -111 | 29 |
| otarius | Georgia | 1879 | 2102 | +223 | 34 |
| AngkyAkdi | Indonesia | 1896 | 1831 | -65 | 35 |
| Azuken | Russia | 1885 | 1703 | -182 | 30 |
| NightBlue | Georgia | 1604 | 1632 | +28 | 19 |
| RoadToHappiness | Russia | 1629 | 1743 | +114 | 66 |
| Aaronli2 | United States | 1673 | 1830 | +157 | 12 |
| denk | Cyprus | 1706 | 1587 | -119 | 34 |
| booleancube | United States | 1638 | 1335 | -303 | 25 |
| Saniok822 | Russia | 1651 | 1597 | -54 | 18 |
| abacaba4613 | Belarus | 1707 | 1911 | +204 | 21 |
| SlavaSSU | Russia | 1727 | 1532 | -195 | 28 |
| Vadim1111 | Belarus | 1793 | 1536 | -257 | 20 |
| George_Rubio | Cuba | 1790 | 1710 | -80 | 18 |
| HenriqueCP | Brazil | 1757 | 1588 | -169 | 32 |
| stefanvil3 | Romania | 1673 | 1931 | +258 | 15 |
| Mokuroh54 | United States | 1791 | 1748 | -43 | 22 |
| Guanexxx | Colombia | 1668 | 1702 | +34 | 48 |
| raresh30 | Romania | 1875 | 2195 | +320 | 25 |
| B00m | Japan | 1720 | 1905 | +185 | 37 |
| osvarp | Colombia | 1787 | 1842 | +55 | 19 |
| El_Roge | Mexico | 1808 | 2018 | +210 | 12 |
| byebye10000 | United States | 1828 | 1645 | -183 | 44 |
| paketik_chaya | Belarus | 1732 | 1792 | +60 | 20 |
| Leeisateam | Singapore | 1745 | 1610 | -135 | 41 |
| ary65537 | United States | 1623 | 1490 | -133 | 45 |
| olasiliksizci | Turkey | 1757 | 1717 | -40 | 42 |
| andrei_p | Romania | 1666 | 1395 | -271 | 47 |
| codexistent | United States | 1648 | 1700 | +52 | 55 |
| IceHydra | Russia | 1710 | 1548 | -162 | 50 |
| gud_day | Singapore | 1793 | 1387 | -406 | 52 |
| andriy.borzenkov | Ukraine | 1609 | 1686 | +77 | 42 |
| Andrei.E | Romania | 1727 | 1672 | -55 | 51 |
| Fakewave | Russia | 1897 | 2126 | +229 | 43 |
| Alexanderter10 | Belarus | 1660 | 1980 | +320 | 53 |
| nemutai | Japan | 1644 | 1700 | +56 | 67 |
| STommydx | Hong Kong | 1664 | 1630 | -34 | 31 |
| tsotnesv | Georgia | 1609 | 1700 | +91 | 47 |
| SunShine11 | Indonesia | 1697 | 1576 | -121 | 72 |
| iuli.morariu | Romania | 1745 | 1667 | -78 | 20 |
| gasbug | Hong Kong | 1607 | 1604 | -3 | 20 |
| Emvy | Russia | 1732 | 1654 | -78 | 30 |
| PinoF | Italy | 1713 | 1487 | -226 | 21 |
| wksp | Poland | 1892 | 1923 | +31 | 25 |
| Mousa_Aboubaker | Libya | 1714 | 1628 | -86 | 95 |
| aslashkin2010 | Russia | 1767 | 2154 | +387 | 22 |
| Rostcraft | Ukraine | 1644 | 1897 | +253 | 15 |
| goncharovmike | Cyprus | 1862 | 1912 | +50 | 39 |
| Ausp3x | Philippines | 1773 | 1755 | -18 | 27 |
| John314 | Cuba | 1819 | 1441 | -378 | 64 |
| at2c | Syria | 1787 | 1631 | -156 | 98 |
| zawatin | Japan | 1835 | 1712 | -123 | 59 |
| marianoferesin | Argentina | 1801 | 1672 | -129 | 15 |
| ianguis | Brazil | 1649 | 1470 | -179 | 23 |
| 0.0 | American Samoa | 1610 | 1767 | +157 | 32 |
| woonder | Poland | 1740 | 1898 | +158 | 40 |
| Datym | Russia | 1600 | 1781 | +181 | 37 |
| reirugan | United States | 1770 | 1987 | +217 | 55 |
| gbula | Georgia | 1607 | 1965 | +358 | 55 |
| murkat | Brazil | 1615 | 1633 | +18 | 25 |
| NikoBaotic | Croatia | 1805 | 1899 | +94 | 40 |
| coder3000 | Greece | 1769 | 1840 | +71 | 57 |
| Neoster4762 | United States | 1608 | 1687 | +79 | 21 |
| Amgad | Syria | 1634 | 1888 | +254 | 31 |
| frederikvase | Denmark | 1858 | 1954 | +96 | 36 |
| newhandIe | Kazakhstan | 1846 | 2013 | +167 | 41 |
| AlexRex0 | Mexico | 1653 | 1580 | -73 | 29 |
| rhineofts | Antarctica | 1730 | 1993 | +263 | 52 |
| espr1t | Bulgaria | 1825 | 1758 | -67 | 37 |
| porcif | Ethiopia | 1679 | 1199 | -480 | 37 |
| PedroPacoca | Brazil | 1654 | 1806 | +152 | 27 |
| M1chael_Petrov | Russia | 1632 | 1604 | -28 | 39 |
| Alg01 | United States | 1781 | 1605 | -176 | 16 |
| eulmelk | Ethiopia | 1744 | 1656 | -88 | 41 |
| leonlian | United States | 1691 | 1515 | -176 | 61 |
| Mohammad_Hacker | Syria | 1862 | 1923 | +61 | 41 |
| Kolyanchick | Russia | 1716 | 1717 | +1 | 16 |
| mkkkkkkkk | North Macedonia | 1607 | 1703 | +96 | 49 |
| zwezdinv | Russia | 1684 | 2512 | +828 | 13 |
| Zain | Russia | 1684 | 1623 | -61 | 31 |
| Pedrinho_Eu | Brazil | 1703 | 1806 | +103 | 82 |
| ymwang | Taiwan | 1826 | 1713 | -113 | 15 |
| Khaled_Al_Awad | Syria | 1809 | 1904 | +95 | 39 |
| fatonims | Ukraine | 1795 | 1913 | +118 | 18 |
| amaruu | Mongolia | 1753 | 1620 | -133 | 28 |
| edga | Latvia | 1779 | 2013 | +234 | 29 |
| pyberion1019 | South Korea | 1707 | 1993 | +286 | 23 |
| FurinaHateComma | Christmas Island | 1716 | 2529 | +813 | 24 |
| ma_moutahid | Morocco | 1835 | 1663 | -172 | 52 |
| Mihajlo18 | Serbia | 1688 | 1500 | -188 | 34 |
| JELlylous | Australia | 1661 | 1616 | -45 | 11 |
| When__CM | Australia | 1640 | 1696 | +56 | 17 |
| BaoCoder613 | Haiti | 1869 | 1793 | -76 | 24 |
| AldyPy | Indonesia | 1658 | 1568 | -90 | 26 |
| lce4113 | United States | 1890 | 1950 | +60 | 68 |
| Leo11wasd | Mexico | 1634 | 1255 | -379 | 38 |
| Rasulov_Ardasher | Tajikistan | 1669 | 1591 | -78 | 36 |
| Chelovek12345 | Kazakhstan | 1614 | 1490 | -124 | 28 |
| deneribeiro10 | Brazil | 1853 | 1641 | -212 | 22 |
| VladX100 | Russia | 1701 | 1620 | -81 | 21 |
| Surge568 | Japan | 1736 | 1985 | +249 | 68 |
| tapris06 | South Korea | 1680 | 1628 | -52 | 24 |
| eggeggwe | Taiwan | 1602 | 1535 | -67 | 29 |
| Jean7 | Syria | 1715 | 1772 | +57 | 16 |
| Arnur2937 | Kazakhstan | 1627 | 1648 | +21 | 60 |
| int23_t | Turkey | 1653 | 1941 | +288 | 15 |
| mrChest | Belarus | 1867 | 1860 | -7 | 29 |
| TiLTovozzik | Russia | 1891 | 1933 | +42 | 79 |
| firework72 | South Korea | 1737 | 1708 | -29 | 31 |
| Nariman_MT | Iran | 1646 | 1833 | +187 | 49 |
| Frexto | Russia | 1627 | 1726 | +99 | 47 |
| MrKisame | Russia | 1619 | 1913 | +294 | 32 |
| Dedibeat | Mongolia | 1655 | 1755 | +100 | 53 |
| MmusoM | Tajikistan | 1739 | 1803 | +64 | 63 |
| Joel_Uwu | Peru | 1643 | 1735 | +92 | 50 |
| Barakat. | Jordan | 1713 | 1585 | -128 | 60 |
| samsoom | Jordan | 1634 | 1897 | +263 | 76 |
| GusavoIsYou | Spain | 1758 | 1870 | +112 | 42 |
| Pooda | Iran | 1647 | 2131 | +484 | 43 |
| doing | Russia | 1807 | 1853 | +46 | 32 |
| Sofiatpc | Brazil | 1695 | 1605 | -90 | 22 |
| dvb1r | Russia | 1642 | 2002 | +360 | 38 |
| Maryan_Shyika | Ukraine | 1624 | 1832 | +208 | 70 |
| m3e92 | Russia | 1713 | 1773 | +60 | 23 |
| ram.bhakt | Antarctica | 1683 | 1867 | +184 | 31 |
| Iroha_3856 | Japan | 1727 | 2135 | +408 | 40 |
| Crbubble | Taiwan | 1812 | 1570 | -242 | 32 |
Pre-AI period, January 2023 — June 2024:
| Handle | Country | Jan 2023 rating | Jun 2024 rating | Delta | Rated contests |
|---|---|---|---|---|---|
| Away_in_the_heavens | Kazakhstan | 1602 | 2089 | +487 | 68 |
| Leeisateam | Singapore | 1683 | 1980 | +297 | 59 |
| Peter-007 | Belarus | 1603 | 2288 | +685 | 55 |
| xhawo | Iran | 1761 | 890 | -871 | 13 |
| zenlog | Russia | 1772 | 2041 | +269 | 25 |
| ChairmanFMao | United Kingdom | 1851 | 1954 | +103 | 25 |
| polosatic | Russia | 1682 | 2181 | +499 | 45 |
| DAleksa | Serbia | 1769 | 2182 | +413 | 27 |
| Phantom_Performer | Georgia | 1873 | 2050 | +177 | 53 |
| sashko123 | Ukraine | 1800 | 2055 | +255 | 79 |
| Alex239 | Canada | 1660 | 2166 | +506 | 87 |
| Piashy | Russia | 1712 | 1739 | +27 | 47 |
| Mirali777 | Russia | 1782 | 2389 | +607 | 57 |
| Hectonit | Russia | 1806 | 1914 | +108 | 68 |
| Frus | Ukraine | 1608 | 1978 | +370 | 75 |
| jmyszka | Poland | 1636 | 1947 | +311 | 56 |
| Ush1su | Germany | 1627 | 1996 | +369 | 53 |
| DiegoGarcia | Mexico | 1786 | 2241 | +455 | 61 |
| singlabharat | Australia | 1608 | 1786 | +178 | 19 |
| bill_lin | Canada | 1685 | 1625 | -60 | 45 |
| cel.in | Croatia | 1779 | 2178 | +399 | 44 |
| Marky | Switzerland | 1756 | 1878 | +122 | 38 |
| dinohaur | Croatia | 1689 | 2167 | +478 | 35 |
| marc2825 | Japan | 1751 | 1815 | +64 | 87 |
| tarche | Argentina | 1816 | 2213 | +397 | 35 |
| blackscreen1 | Singapore | 1781 | 1987 | +206 | 11 |
| jalalium | Morocco | 1649 | 1673 | +24 | 63 |
| naniim | Brazil | 1803 | 1823 | +20 | 58 |
| N00BGH0ST | Russia | 1751 | 1926 | +175 | 68 |
| kidw0124 | South Korea | 1894 | 1997 | +103 | 31 |
| dzhi | United States | 1722 | 1647 | -75 | 57 |
| sadness | Russia | 1648 | 2155 | +507 | 19 |
| peshkoff | Russia | 1640 | 1673 | +33 | 38 |
| Timur2006 | Russia | 1796 | 1863 | +67 | 38 |
| dimash1 | Kazakhstan | 1631 | 1718 | +87 | 109 |
| Chaska | Mexico | 1652 | 1834 | +182 | 42 |
| diobrando97 | Taiwan | 1800 | 1936 | +136 | 59 |
| Zain | Russia | 1793 | 1927 | +134 | 55 |
| LittleXi | Hong Kong | 1639 | 2125 | +486 | 66 |
| skylol | Canada | 1718 | 1810 | +92 | 15 |
| delena0702 | South Korea | 1891 | 2002 | +111 | 21 |
| sedev57 | South Korea | 1824 | 2095 | +271 | 48 |
| RockSnow | Portugal | 1869 | 1840 | -29 | 54 |
| ivxxn | Belarus | 1691 | 1784 | +93 | 39 |
| SUL | Syria | 1777 | 1788 | +11 | 44 |
| k1suxu | Japan | 1877 | 2065 | +188 | 17 |
| francesco | Italy | 1635 | 2206 | +571 | 44 |
| CatalanConvolution | Montenegro | 1742 | 2209 | +467 | 27 |
| Piokemon | Poland | 1748 | 1937 | +189 | 34 |
| dino_merlin | Bosnia and Herzegovina | 1820 | 1942 | +122 | 57 |
| MarcosPauloEvers | Brazil | 1787 | 1776 | -11 | 42 |
| Mohammad.Nour | Syria | 1667 | 1443 | -224 | 48 |
| raulandreipop | Romania | 1799 | 1955 | +156 | 54 |
| Java | United States | 1835 | 2110 | +275 | 28 |
| tnaito | Japan | 1754 | 1911 | +157 | 101 |
| AlexRex0 | Mexico | 1679 | 1678 | -1 | 52 |
| angryarabianman | Cyprus | 1617 | 2016 | +399 | 45 |
| c2zi6 | Armenia | 1620 | 1904 | +284 | 40 |
| Munkh-Orgil416 | Mongolia | 1669 | 1638 | -31 | 26 |
| wojciech_domin | Poland | 1780 | 2001 | +221 | 15 |
| n685 | United States | 1866 | 2035 | +169 | 18 |
| cristi_tanase | Romania | 1613 | 2114 | +501 | 43 |
| NeroZein | Syria | 1752 | 1947 | +195 | 50 |
| yottabot | United Kingdom | 1641 | 1648 | +7 | 72 |
| CyberCow | Armenia | 1679 | 1993 | +314 | 58 |
| amaruu | Mongolia | 1711 | 1944 | +233 | 83 |
| dmkozyrev | Russia | 1830 | 1860 | +30 | 31 |
| MADE_IN_HEAVEN | Georgia | 1640 | 1752 | +112 | 83 |
| paran | South Korea | 1659 | 1752 | +93 | 26 |
| Pompeii | Antarctica | 1768 | 2155 | +387 | 13 |
| Fu_L | Japan | 1893 | 2135 | +242 | 15 |
| bugdone | Romania | 1660 | 1854 | +194 | 80 |
| HunterXD | El Salvador | 1863 | 1802 | -61 | 28 |
| brenner1 | Brazil | 1838 | 2078 | +240 | 59 |
| Ststone | Taiwan | 1733 | 1921 | +188 | 51 |
| andreumat | Belarus | 1747 | 1628 | -119 | 21 |
| estoy-re-sebado | Argentina | 1764 | 2014 | +250 | 35 |
| orangesTO | United States | 1605 | 1553 | -52 | 79 |
| zhukau | Belarus | 1635 | 2102 | +467 | 72 |
| nickbelov | United States | 1686 | 2001 | +315 | 64 |
| dmot | Mexico | 1629 | 1961 | +332 | 77 |
| komite | Japan | 1826 | 2128 | +302 | 47 |
| FBI | Ukraine | 1723 | 1783 | +60 | 67 |
| Edu175 | Argentina | 1760 | 2352 | +592 | 66 |
| qq11123334 | Taiwan | 1759 | 2144 | +385 | 30 |
| fingerdash | France | 1791 | 1920 | +129 | 30 |
| Abdulrahman27 | Syria | 1830 | 2089 | +259 | 56 |
| EnDeRBeaT | Russia | 1780 | 1965 | +185 | 14 |
| SOCIOPATE | Belarus | 1835 | 1872 | +37 | 15 |
| Giga_Cronos | Cuba | 1800 | 2279 | +479 | 64 |
| masa.dobric | Croatia | 1623 | 1927 | +304 | 28 |
| SF1yer | Antarctica | 1733 | 2064 | +331 | 17 |
| gs20036 | South Korea | 1704 | 1972 | +268 | 34 |
| urosk | Serbia | 1781 | 1699 | -82 | 29 |
| Pacybwoah | Taiwan | 1700 | 2085 | +385 | 16 |
| umezo | Japan | 1689 | 1841 | +152 | 37 |
| tvladm | Romania | 1670 | 1975 | +305 | 17 |
| dasha..zhilina | Russia | 1616 | 1552 | -64 | 36 |
| Majedh | Syria | 1656 | 1798 | +142 | 93 |
| Esomer | Spain | 1764 | 2215 | +451 | 49 |
| yamate11 | Japan | 1893 | 1861 | -32 | 23 |
| D3Xtr | Romania | 1854 | 1862 | +8 | 27 |
| Makha | Kazakhstan | 1605 | 1899 | +294 | 35 |
| 160cm | Ukraine | 1629 | 2113 | +484 | 45 |
| ezdp | Bulgaria | 1678 | 1774 | +96 | 34 |
| FranSkarica | Croatia | 1810 | 2015 | +205 | 25 |
| Vladosiya | Russia | 1701 | 1913 | +212 | 33 |
| csegura | Mexico | 1769 | 1992 | +223 | 43 |
| batmend_kh | Mongolia | 1835 | 1983 | +148 | 33 |
| jamesbamber | Italy | 1851 | 2167 | +316 | 30 |
| WipeyTabletku | Ukraine | 1740 | 1908 | +168 | 19 |
| Hasan0540 | Jordan | 1849 | 1963 | +114 | 28 |
| Lol2004 | Russia | 1696 | 2102 | +406 | 65 |
| FedeNQ | Argentina | 1872 | 1759 | -113 | 39 |
| PsychoPinkQ | Taiwan | 1665 | 1772 | +107 | 46 |
| k1r1t0 | Belarus | 1684 | 2504 | +820 | 45 |
| flamestorm | United States | 1891 | 2250 | +359 | 35 |
| David-M | Georgia | 1844 | 1948 | +104 | 20 |
| jtrh | Malaysia | 1670 | 2025 | +355 | 34 |
| ivan.alexeev | Russia | 1645 | 2220 | +575 | 25 |
| octane | South Korea | 1745 | 1802 | +57 | 22 |
| coderbd | Hong Kong | 1727 | 1770 | +43 | 103 |
| stefanopulos | Serbia | 1771 | 2063 | +292 | 19 |
| ArSarapkin | Russia | 1667 | 2291 | +624 | 22 |
| SnowLucario_Z | Canada | 1835 | 2209 | +374 | 68 |
| people_plus_plus | Russia | 1683 | 1920 | +237 | 33 |
| L_Wave | Antarctica | 1686 | 2129 | +443 | 20 |
| omikad | Netherlands | 1607 | 1798 | +191 | 58 |
| NintsiChkhaidze | Georgia | 1692 | 1846 | +154 | 45 |
| mjnbcfbot | United States | 1809 | 1806 | -3 | 75 |
| McPqndq | Canada | 1789 | 2118 | +329 | 29 |
| ccy | Taiwan | 1796 | 1894 | +98 | 35 |
| Marco_Escandon | Cuba | 1605 | 1705 | +100 | 27 |
| Son | Indonesia | 1847 | 1676 | -171 | 23 |
| QuinnG | United States | 1678 | 1853 | +175 | 18 |
| edogawa_something | Syria | 1734 | 2048 | +314 | 55 |
| kinnikuma | France | 1847 | 1829 | -18 | 47 |
| qwusha | Sweden | 1626 | 1896 | +270 | 17 |
| andreyDagger | Russia | 1856 | 2260 | +404 | 32 |
| The-Winner | Romania | 1897 | 2112 | +215 | 34 |
| ayhan23 | South Korea | 1808 | 1890 | +82 | 38 |
| Dolce_Banana | Russia | 1632 | 2123 | +491 | 20 |
| kafamcokkaristi | Turkey | 1622 | 2181 | +559 | 76 |
| deneribeiro10 | Brazil | 1611 | 1699 | +88 | 31 |
| tonyu0 | Japan | 1703 | 1603 | -100 | 38 |
| miniL | Russia | 1723 | 1693 | -30 | 51 |
| TurboChemtank | Antarctica | 1600 | 1892 | +292 | 44 |
| ahyeon | Kazakhstan | 1804 | 2187 | +383 | 62 |
| jackson.souza | Brazil | 1659 | 1983 | +324 | 45 |
| abunyawa | Kazakhstan | 1641 | 1640 | -1 | 43 |
| ksu_ | Ukraine | 1641 | 1887 | +246 | 33 |
| kaichou243 | Japan | 1746 | 1637 | -109 | 22 |
| zhassyn | Kazakhstan | 1632 | 1758 | +126 | 33 |
| _Crimson_ | Kyrgyzstan | 1846 | 1822 | -24 | 66 |
| petamingks | South Korea | 1813 | 2296 | +483 | 48 |
| jwkim0108 | South Korea | 1809 | 2109 | +300 | 20 |
| Ghassane | Italy | 1800 | 1728 | -72 | 47 |
| Elliptical_Curve | Mexico | 1672 | 1888 | +216 | 26 |
| Franchu | Argentina | 1673 | 1621 | -52 | 69 |
| ahsoltan | Poland | 1718 | 2310 | +592 | 68 |
| JuicyGrape | Ukraine | 1676 | 1694 | +18 | 68 |
| oursaco | United States | 1756 | 2267 | +511 | 27 |
| daukah | Kazakhstan | 1709 | 2208 | +499 | 50 |
| jununu0811 | South Korea | 1653 | 1957 | +304 | 41 |
| FTS_Problem_C | Syria | 1807 | 1886 | +79 | 69 |
| SleepingCat | Russia | 1706 | 1775 | +69 | 48 |
| A.G.E | Syria | 1609 | 1493 | -116 | 40 |
| Ferume | Russia | 1808 | 1993 | +185 | 50 |
| umimel | Japan | 1736 | 1939 | +203 | 49 |
| ajxu2 | United States | 1701 | 1826 | +125 | 21 |
| cr7ro | South Korea | 1710 | 1715 | +5 | 33 |
| Morley | Germany | 1622 | 2135 | +513 | 10 |
| waipoli | Germany | 1630 | 2171 | +541 | 42 |
| nooooob_KiFaH_HeLaL | Syria | 1879 | 2109 | +230 | 43 |
| Probka | Russia | 1612 | 2136 | +524 | 25 |
| ilgizarka | Russia | 1626 | 1794 | +168 | 42 |
| annyeong1 | South Korea | 1694 | 1989 | +295 | 86 |
| flakepym | South Korea | 1818 | 1874 | +56 | 29 |
| Leonardo_Toral | Mexico | 1665 | 1712 | +47 | 18 |
| smalyarovsky | Cyprus | 1837 | 2055 | +218 | 27 |
| Sochu | Romania | 1641 | 1690 | +49 | 26 |
| Alexbrii | Mexico | 1665 | 1800 | +135 | 59 |
| CodeGuy | Angola | 1621 | 1706 | +85 | 12 |
| ceciver | Morocco | 1602 | 1644 | +42 | 55 |
| bhatnagar.mradul | United Kingdom | 1618 | 1814 | +196 | 54 |
| Razvan_Rotaru | Romania | 1720 | 1683 | -37 | 63 |
| Mirbek | Kyrgyzstan | 1826 | 1858 | +32 | 69 |
| Khaled_Mardini | Syria | 1804 | 1901 | +97 | 51 |
| Seungni | South Korea | 1632 | 1735 | +103 | 35 |
| Klaus26 | Colombia | 1614 | 1769 | +155 | 36 |
| Gogolev | Russia | 1606 | 1764 | +158 | 41 |
| GM_Dan4Life | Nigeria | 1645 | 1592 | -53 | 20 |
| Hausdorf | Russia | 1765 | 1853 | +88 | 21 |
| danx | Spain | 1709 | 1989 | +280 | 49 |
| katonyonko | Japan | 1842 | 1770 | -72 | 44 |
| Tonyl | Czechia | 1666 | 1797 | +131 | 18 |
| zarubin | Russia | 1698 | 1933 | +235 | 35 |
| AbsurdMan | Russia | 1741 | 1844 | +103 | 93 |
| prairie2022 | Taiwan | 1836 | 2134 | +298 | 33 |
| royayaha | Taiwan | 1656 | 1837 | +181 | 59 |
| OG_Matveychick1 | Russia | 1809 | 2227 | +418 | 68 |
| D4nnyLee | Taiwan | 1629 | 1514 | -115 | 63 |
| goncharovmike | Cyprus | 1765 | 1931 | +166 | 55 |
Limitations
- I didn't check all the sampled users manually, so there could be cheaters among them. That would make the results underestimated.
- Learning is becoming more effective over time, especially with AI tools. That also makes the results likely underestimated.
Conclusion
The rating deflation for legitimate participants is around 150-190 rating points. But it seems it only gets worse.
P.S. I can't miss an opportunity and mention that I am building Codeforces Community Rating, which uses peer reviews to create a list of users who are more likely to respect sportsmanship. You can join too and help with the reviews.


maybe you should also keep in account the contest volume i mean the number of contests given by people as i know some people who were frequent contest givers before the ai era and now they only give few contests and less practice and hence mostly getting a negative delta
I did take that into account to some extent. It was one of the control variables used for sampling. Check out
Rated contestscolumn in sampled tables.i see sorry i didnt see that in the blog
In June 2024 it was when 4o just came out, while models like GPT-4 was not able to solve problems by itself, it already aids in debugging (esp. non-algorithm parts like undefined behaviors), quick gen of templates, etc. So AI already helps contestants somewhat.
AI was not banned in contests until September 2024 so anyone using it beforehand was not a cheater.
I think these are some very good methods, most sources of confounding are accounted for. Maybe even better could be having a bunch of people virtual 2022 era vs 2025 era rounds at the same time and run a matched pair t test on the results (it does take a lot of volunteers though)
Interesting solution. A potential confounding variable is general improvement in pariticpant disreagrding ai entirely tho. Very cool expeirment to run and potentilly see and very glad to see something from ap stats finally in an actual conversation. orz greateric
Real I love stats lol. My suggestion to mitigate the improvement effect is to have them do the two rounds back to back though, like maybe a few days apart. (You can also randomize which one they do first to be extra sure)
I think the methodology is good and I would consider this actual finding. It is just 50 samples may really be too small (might be report a t-stat or other statistical tests as applicable)? Also may be interesting to see a correlated sampling of how the same person rating changed in the two eras, though this definitely biased towards long time competitors.
Thank you. I've added 95% confidence intervals (Welch for the mean gap and bootstraped for the median gap) and removed the weakest filter to allow larger cohorts.
For the cohort size, they are naturally small (especially $$$\ge 2400$$$ cohort), since I combined multiple simple filters, like region restrictions and some other activity related filters. I believe this also answers t3jtex question.
why only 50 users?
because 50 users are good enough to approximate the distribution
Maybe it could be a good idea to use lists of IOI participants who are also known active Codeforces users for such comparisons, e.g. 6 months before IOI?
As we know, these people are motivated to get better asap, because they have to demonstrate their real skills in person. It doesn't make sense for them to cheat and inflate their ratings, at least in the months leading up to the IOI, as doing so would only increase the pressure to achieve the expected results and would undermine their confidence.
You can't really use in-person contests for measuring skill against CF rating because:
They often follow a different format. IOI has problems with subtasks and no access to the internet/code templates. ICPC has code templates but it's a team competition so individual skill is not possible to deduce
In-person competitions are much less frequent than CF so you have less datapoints for each person.
The stakes are much higher so you have the effect of stress and extra practivce shortly before the competition.
Overall these biases might put the validity of any conclusions you make into question.
Anecdotally, I noticed similar deflation among my friends on Atcoder. However, the situation seems to have improved after they increased the initial rating for new accounts from 800 to 1200 (from roughly 1300 to 1600 in Codeforces ratings) in October last year: https://atcoder.jp/posts/1592 They didn't mention AI cheating in that post, but it's definitely one reason why new accounts are, on average, stronger than in previous years.
Codeforces could consider doing something similar. Although this doesn't fight the root cause, it's a pragmatic approach that would reduce much of the frustration caused by the increase in cheating. It would help prevent legitimate users from becoming demotivated when their rating progression stalls.
If I understand correctly, the main benefit of increasing the initial rating is reduction of penalty when old users lose to newcomers, since in an Elo system losing to 1200 rated participants is about one magnitude more likely than losing to 800 rated participants.
While it surely helps to some extent, it feels to me that right now the concentration of bad actors skews the distribution even more, than the increase from 800 to 1200 can absorb. Notably, the Atcoder change was introduced in October 2025, before the agentic boom started in November 2026.
Also, I think that Codeforces tanks more AI damage by simply being more popular than Atcoder. So if the current 1400 initial rating is increased, the delta should probably be larger than Atcoder's.
However, I haven't done any research on this topic yet, so take it with a grain of salt.
good excuse for not reaching cm :P
Sure, whatever you say.
XD
while I do appreciate the database as a source of history but you can find 100 people on codeforces who all will say that I haven't cheated in the last 1.5-2 years so idk ;)
Good for you, if that's true.
Also, for a second I thought that your comment could've been addressed to the author of the blog, which would've been quite funny, which is why I replied like that.
And I thought I was losing my touch with CP after losing so much rating and not being to go back up again.
I think the biggest takeaway is not the exact value of 150–190, but that the natural improvement visible in the pre-AI cohorts almost disappears in the AI period. That seems more concerning than the absolute numbers themselves.
It's even worse, in my opinion. Because with AI one is expected to learn and improve faster, yet even then, the nominal improvement is close to 0, if not far below 0.
Me as an example. You can see my rating charts.
I stays between Candidate Master and Master from 2022 until Jan 2026. Then after Jan 2026, my rating just dropped very big and now I am a expert. I have never reached expert before.
Previously I can solve ~2300 rating problem and ~2500 ancient problem, now a 2000 rating make me headache.
Same. There have been several contests when I felt I performed 'perfectly', while carrot showed I was going to lose rating. This is extremely frustrating.
Two years ago I almost reached Grandmaster. After two years' hard training, I can hardly maintain my master color now.
Funny coincidence: I had even had a discussion about your case alongside a few other cases with
stolendeflated rating before writing the blog.AI period, January 2025 — June 2026:
SnowLucario_Z Canada 1987 1877 -110 43
Pre-AI period, January 2023 — June 2024:
SnowLucario_Z Canada 1835 2209 +374 68
I mean if I'm being featured in such a data analysis that is implying a rating change pre AI and during AI large enough to be a public embarrassment, and that I have been doing a Masters in Data Science program for the last 10 months, I have to respond to this because while I can agree somewhat there is some rating deflation there are parts of this study that I have thoughts about.
By comparing the rating changes between two periods you are essentially comparing the account rating change for each user from an account that is X to X+1.5 years old to the rating change when the account is X+2 to X+3.5 years old. This comparison is inherently going to favour the pre-AI period as most accounts on Codeforces will a rating progression that resembles a logarithmic curve (steady increases in rating until a certain rating wall is reached in which further concepts need to be learned to progress). It is more effective to determine a large set of legitimate users, randomly divide them into pre AI and post AI groups, and then compare their rating changes there with taking account age as a possible confounder.
Frequency of contests is another factor that is associated with practice time, but this is also hard to quantify. Even the difference in contests done on Codeforces does not accurately show the lack of online practice I've done recently compared to my CLIST profile https://clist.by/coder/alxwen711/?upsolving=off; the only account that really has comparable activity recently is Leetcode and that's mostly me just having fun (sometimes) speedrunning the contests. You can look at all other accounts and you'll find there is far more of a practice difference here. Even in 2025 a lot more of this practice was done with a focus on ICPC rather than trying to push rating. And in the cases where I actually lock in to practice on a higher volume such as around Sep-Nov 2025 when it was my last shot at ICPC and getting to NAC it is not surprising I saw a resurgence there. Then afterwards once I had more of a commitment to the Masters program I then started falling off.
Given how rating change is variable from contest to contest, why would we not use something more akin to a moving average rather than relying on the snapshots of the rating at each endpoint of a period? There are definitely cases in which the rating difference for individuals will be heavily skewed just because they had an abnormally good/bad contest at a specific time.
Pre AI period is defined as Jan 2023 to Jun 2024, but the actuality is that everything before 2024 can be called a Pre AI period. There is certainly an argument that rating deflation has been occurring since Codeforces became a thing in 2010 because the coderbase just naturally got better over time. This is observable through problem ratings which are just a function of who solved the problem during the live contest; https://codeforces.me/contest/4/problem/D from the very first contest is a 1700 rated problem and is basic graph dp, nowadays this would not be a 1700. And this was before ratings were really calibrated; we can find problems in 2011 such as https://codeforces.me/contest/93/problem/D which would absolutely not be a 2500 rated problem in 2023 or 2026.
The cohort sizes themselves are fine but what exactly is stopping us from using other lower brackets for comparison? I would assume the point of only going to 1600 was to include mainly coders that have sufficient contest data and are of some competence, but when the rating distribution of active coders (using https://codeforces.me/blog/entry/151862 as reference) is such that the median coder is around 1200, there are sufficient cases of legitimate coders not considered in this study.
Okay now that I've gotten through most of my serious thoughts, I might as well add some less serious thoughts here:
There really should be a check to see if coders are just getting more problems on average in contests, whether that be because of actual cheating or problems generally being "easier". I can't be the only one that remembers when 4 problems on Div 2 was pretty much a lock for CM.
My pre-AI data gets used for the 1600-1900 group but the AI data gets used for the 1900-2100 group. This feels incorrect in a data science sense. Also it is coming to me now that it is just more inherent that the higher you go, the easier it is to see a rating drop. I mean if you have several contests with favourable problems and end up overrated in the system at a new personal rating high, it should be more likely that the next contest is a rating drop.
I'm still irritated that I have to see that I'm this low in rank compared to my peak even with considering I have less time for practice nowadays.
I used to like square numbers like 484. This post makes me hate 484.
I swear I better wake up for next Saturday's CF round. In fairness I missed the last few due to exhaustive oversleep from grinding through a capstone project the night before. Said capstone is also why I haven't been doing 5AM AtCoder.
Anyone blaming cheaters as the main reason for their rating drop are whiny losers that need to genuinely ask how much of their time ranting/witchhunting could have been used to actually maintain and finetune their abilities.
Surely there are other people that do competitive programming because it's fun. Obviously the cheaters would not understand and I really have nothing but apathy for them. I do laugh when they claim they put 1400 CF on a resume like asking a LLM for a modest numerical value of programming "thinking ability" is apparently an accomplishment.
Um_nik was right
I'm glad that you were interested enough in the research to write this long comment. However, you seem to have missed many points of my report. I will try to address some of them.
No, I don't do that. Contestants are split into cohorts based on their starting rating. Some contestants might be in cohorts in both periods, but again, they are assigned to a cohort based on starting rating. Also, most users are not even present in both cohorts: 174 of 595 AI-period users also appear in the pre-AI cohorts.
Your conclusion is based on a wrong assumption, so it happens to be wrong too.
One needs a lot of time to determine this large set. I don't have this time, so I used simple legitimacy filters, which I don't plan to disclose for obvious reasons.
Rating is already a moving average of performances over contests.
I took two periods of same length.
I didn't have enough time, so I cut some corners.
I don't think an Elo rating works this way.
It might add some correlation, sure. But it's definitely not "incorrect" in any reasonable sense. We usually don't have iid samples in real life.
Ok, cherry on top. That's your opinion. My opinion is that people who think this way are temporarily delusional. Once LLMs are good enough to make the comparison between a human CPer and an LLM user close to the comparison between a human runner and a car driver, you might understand. Or might not. Anyway, that's your business and opinion.
Bonus: fun exercise, ask your question "how much of their time ranting/witchhunting could have been used to actually maintain and finetune their abilities" these contestants from my study:
Also, wery0 and Teja-Smart, already mentioned below, so my tagging isn't unexpected, might englighten us on this matter as well.
Thanks for replying to my questions, and I apologize for a lot of the wrong interpretations I made on this study and the overall crashout I was initially having. Admittedly not really having the time to really do competitive programming as I liked in recent months, combined with having to see a new set AI cheater posts appear after every contest has gotten to me, but several of my comments were very unnecessary.
I've thought about the methodology more carefully. It is more logically sound than what I was initially thinking, and stating that there is roughly a 150-190 rating point deflation in between these two periods is valid. The one thought with this method is that suppose we conducted this study over the same periods but 5 years back, so Jan 2018 to Jun 2019 and Jan 2020 to Jun 2021, and found there was also roughly a 150-190 point deflation in between these two periods. There isn't anything explicitly special about these time periods, but if they were to have the same or a similar point deflation occurring, this would bring into question how much of this point deflation found was actually AI related or just a product of time.
We could measure it, but I think rating inflation in the past is fairly well known. For example, this, and this, and there has to be another blog in which LGM was changed from 2900 to 3000.
"Sun tends to make the sky blue", new study reports.
Did anyone really need your statistical analysis to believe this? At least find a more interesting claim to make than "people are losing rating".
Yes I found this really interesting. Now that I saw statistical analysis, I believe the claim much more than I did when I only read anecdotes. idk why you're being a hater for no reason.
I don't like seeing effort being wasted to "prove" something that's obvious. Use your effort to give us a new insight.
You mix up qualitative and quantitative analysis. My research is mostly quantitative.
I hope that some people did.
Moreover, there is a popular opinion that says something like "just get good, stop coping, stop caring" in the context of AI cheating. Although I think that people who spread this opinion are either ragebaiting or aren't good at reasoning, and the report is probably of little value to them, there are other people who can reason, and my small research could help them better understand reality.
Say, a while ago I did another research that debunks another popular delusion that cheaters from certain regions are abundant only because there are so many participants from these regions.
Again you mix up qualitative "people are losing rating" with quantitative "people are losing X rating".
Your conclusion is wrong, rating deflation is around 600 points, just look at my profile.
It's actually 800 look at Teja-Smart
Yeah, that's rough. I wonder what the mean delftation delta will be in one year from now.
can confirm
I guess that explains why performance according to carrot in virtual participations from old contests seemed to be very inflated compared to my actual contest performance. There is around 300 or 400 difference.
It's also because old problems (say, 6-7 years) of the same difficulty are significantly easier than recent (1-2 years) problems, as CP training gets better over time and learning gets more efficient.
Sample size for >=2400 is too small for a range that wide, might be better to just have it for [2400,3000], since LGM ratings have high variance from what I have seen. Also, I think you should compare two pre-AI periods of similar length (2022-2023 vs 2023-2024), so, if there is a bias that isn't time specific then that could be seen as well
I don't really understand your point about small sample size. The sample size being too small is a relative statement. As you can see, the width of CI for $$$\ge 2400$$$ cohort is already very close to the width of CIs for cohorts $$$[2100, 2400)$$$ and $$$[1900, 2100)$$$. Therefore, I don't think that the sample size of $$$\ge 2400$$$ cohort is too small in particular.
Also, LGMs can have higher variance, but this variance is smoothed by the moving average (which is how rating works), since I compare not 2 contests but the delta across multiple contests. Moreover, the ratio of LGMs in the cohort isn't very high.
The comparison of two pre-AI periods can be done, but rating inflation in the past is somewhat well known already. I posted several links above.
Fair enough about the CI point, the variance seems similar for both.
i haven't seen more coping than this blog ever. just go solve more problems instead of whining about cheaters and posting useless blogs. why are cyan/green/pupil blogs always like that. maybe you are cyan because you waste time on blogs instead of training???
i haven't seen a more retarded comment than this ever. also, the author of the blog was literally high blue in rating, not that it changes the value of the content
this is bro's alt btw
I just used Codex to do a similar analysis for veteran high rated users. Here is my finding:
This is evidence of a substantial rating loss inside this cohort. It is not enough, by itself, to prove that the entire Codeforces rating scale is deflating.
1. Sample
I assembled a sampling frame of 757 active users. Here, "active" means having at least one rated contest from January 28 through July 27, 2026. The frame was built from a top-rated-user snapshot together with additional rank-list screenshots, with the goal of covering almost all active users rated at least 2200.
This is not an official census, so "almost all" should be understood as a coverage goal rather than a formally verified claim.
For the main analysis, I call a user trusted (or "veteran red") if:
I then require at least 3 rated contests between January 1 and July 27, 2026, so that the comparison is not determined by one or two rounds.
2. Matching the number of contests
Simply comparing calendar periods can be misleading: someone who plays 20 rounds has much more opportunity to gain or lose rating than someone who plays five.
For every user, let $$$n$$$ be their number of rated contests in 2026. I compare three consecutive blocks:
Thus, each user's three blocks contain exactly the same number of contests. The reported values are means of these user-level cumulative changes, so every user receives equal weight.
3. Breakdown by pre-2025 peak
The bands below use each user's peak achieved before 2025, rather than a peak that could include the outcome period.
The loss is visible in every band. The higher-peak groups lost more on average, but this table alone does not establish that peak rating causes a larger decline. Overall, 67.5% of these users lost rating in 2026.
4. What does this mean?
The narrow conclusion is:
However, Codeforces rating is approximately redistributive. Rating lost by this selected group is mostly gained by competitors outside the group. Therefore, a negative mean for veteran reds does not automatically imply that the global rating scale moved downward. It may also reflect:
In particular, this analysis cannot attribute the change to AI use, changes in problem style, or any other single cause.
I would be interested in alternative explanations or better control groups. For example, what would be the best way to distinguish veteran decline from a real shift in the calibration of the global rating scale?